
 Home
Home News
News
- 1 LUNC token price was in a downtrend and persisted in draining the gains.
- 2 Terra Classic (LUNC) token is now engaged in base formation near $0.0001100.
The LUNC token met selling pressure and depicted a steep decline in the past weeks, replicating the underperformance. Moreover, the token did not participate in the market rally and was on the list of top losers. The price action denotes the lower lows and is taking its final puff on the 200-day EMA, a crucial zone. However, the buyers have nailed the paws and are engaging in bottom formation.
The LUNC token price is trading at a make-or-break region and sellers are attempting to stretch the down move below the 200-day EMA for a sharp fall. However, the token looked oversold and may attain a bounce toward $0.0001200 soon. The price action conveys that LUNC crypto was in the bears’ control and they do not permit the bulls to lift the gains.
This cryptocurrency trades at $0.0001114 at press time, with an intraday drop of 1.82%, showing range-bound moves. Moreover, the trading volume increased by 2.30% to $43.63 Million, highlighting low investor interest. The pair of LUNC/BTC was noted at 0.00000000269 BTC while the market cap is $760.68 Million. Analysts are bearish and suggest that the LUNC crypto will continue to extend the down move and may retest $0.0001000 soon.
LUNC On Daily Charts Reflects Distribution from Highs
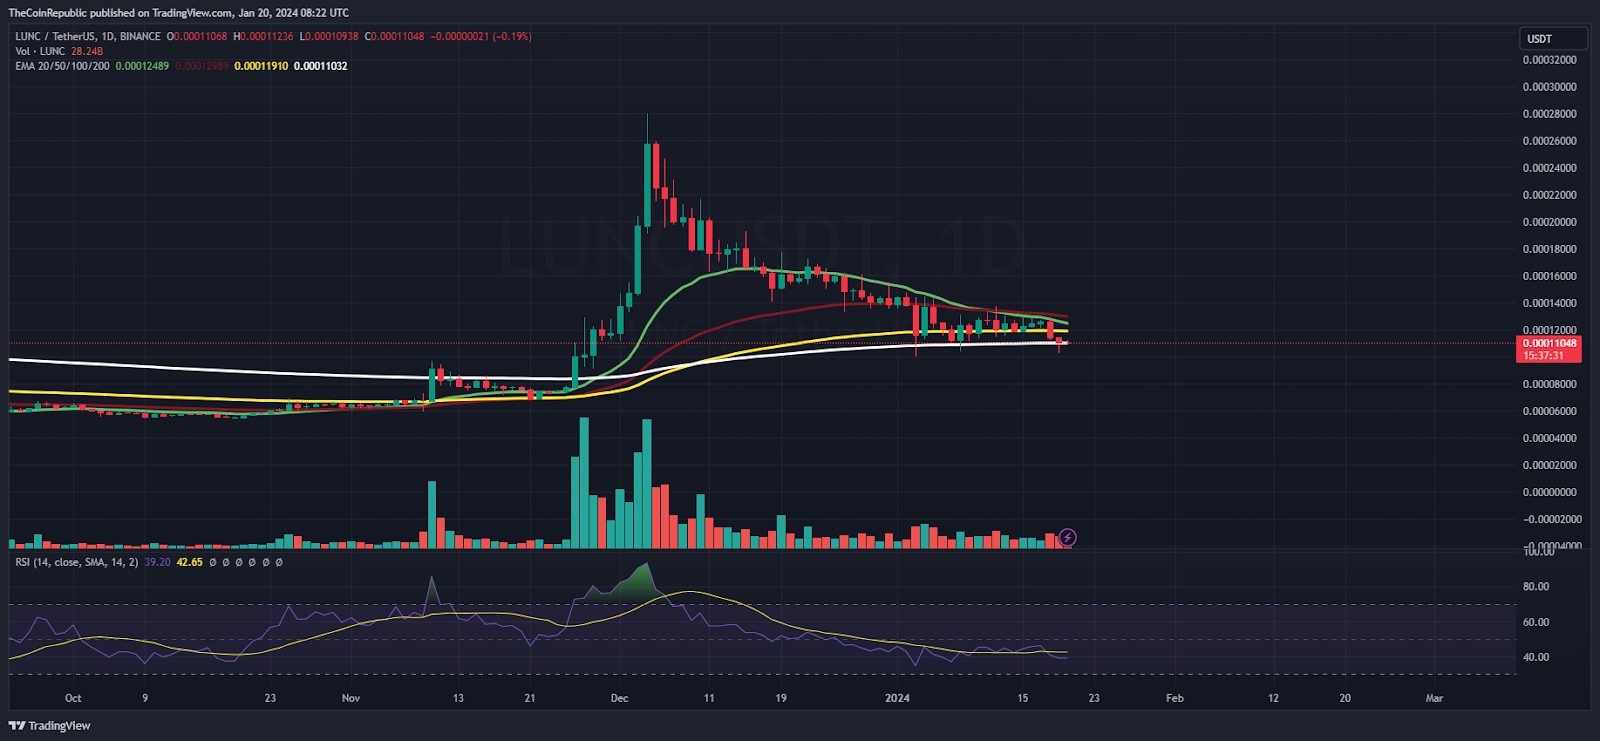
On the daily charts, the LUNC crypto is showcasing underperformance and is stumbling to hold the gains amidst the selloff. Moreover, the token portrays a retracement from the highs of $0.00027960, eroding over 60% of gains in the recent sessions. Bears are delivering their legacy and persist in adding short positions, which creates pressure on the buyers while attempting a rebound.
The Relative Strength Index (RSI) curve is in the oversold region and displays a negative divergence. Similarly, the MACD indicator shows a bearish crossover and forms red bars on the histogram reflecting the bears’ dominance. Additionally, the token has slipped below the 38.2% Fib level and is on the verge of the 23.6% zone.
LUNC on Weekly Charts Displays a Sharp Turnaround
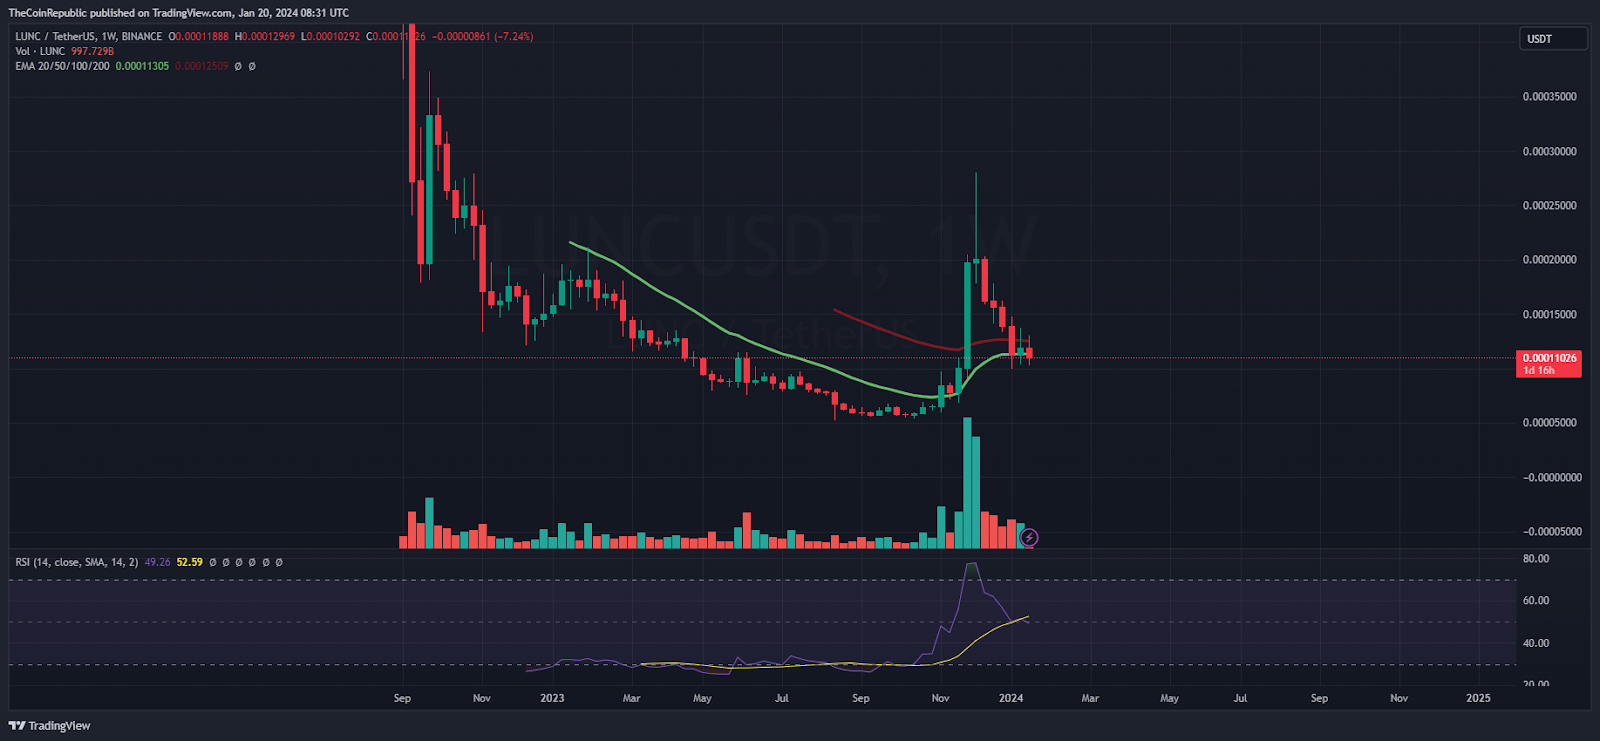
On the weekly charts, the LUNC token showcased a harsh reversal from the top, which led buyers to be trapped. The chart reflects an inverted hammer candlestick on the top and a follow-on selling pressure was displayed, which has been a concern in the past weeks.
Summary
Terra Classic (LUNC) token showcases sellers’ dominance and has supplied a massive fall from the top. However, the token halts the gains and creates a base, which may lead to a bounce soon. Moreover, the 200-day EMA mark was a support and buyers are looking for a rebound.
Technical Levels
Support Levels: $0.0001100 and $0.0001000
Resistance Levels: $0.0001270 and $0.000400
Disclaimer
The views and opinions stated by the author or any other person named in this article are for informational purposes only and do not constitute financial, investment, or other advice. Investing in or trading crypto or stocks comes with a risk of financial loss.

Adarsh Singh is a true connoisseur of Defi and Blockchain technologies, who left his job at a “Big 4” multinational finance firm to pursue crypto and NFT trading full-time. He has a strong background in finance, with MBA from a prestigious B-school. He delves deep into these innovative fields, unraveling their intricacies. Uncovering hidden gems, be it coins, tokens or NFTs, is his expertise. NFTs drive deep interest for him, and his creative analysis of NFTs opens up engaging narratives. He strives to bring decentralized digital assets accessible to the masses.


