
 Home
Home News
News

- 1 UNI token is hovering near the 20-day EMA mark and is showing uncertainty.
- 2 Buyers have regained strength and are keen to retain to surpass $7.
UNI token (Uniswap) was in a dilemma and is hovering near the 20-day EMA mark, reflecting volatile moves in the recent sessions. The price action reveals neutrality and buyers are struggling to surpass the neckline of $7. The UNI token was in an uptrend for the past sessions, but a sudden trendline breakdown led to fear among investors. However, the token managed to halt the gains and is hovering between $6 and $7.

UNI token exhibits a pullback from the 100-day EMA and is waiting for a rebound to escape the trajectory hurdle of $7. Meanwhile, the token formed a head-and-shoulders pattern, a sign of bearishness. If the token slips below $5.80, sellers will lead the down move and stretch the token toward $5. The trend still needs to be clarified and a fake bounce was witnessed.
This cryptocurrency trades at $6.46 at press time, with an intraday gain of 1.87%, showing range-bound moves. Moreover, the trading volume increased by 15.30% to $109.05 Million, highlighting uncertainty. The pair of UNI/BTC was noted at 0.000156 BTC, while the market cap is $5.61 Billion. Analysts are neutral and suggest that the UNI crypto will continue to showcase volatility in the upcoming sessions.
UNI on Daily Charts Displays Bidirectional Moves
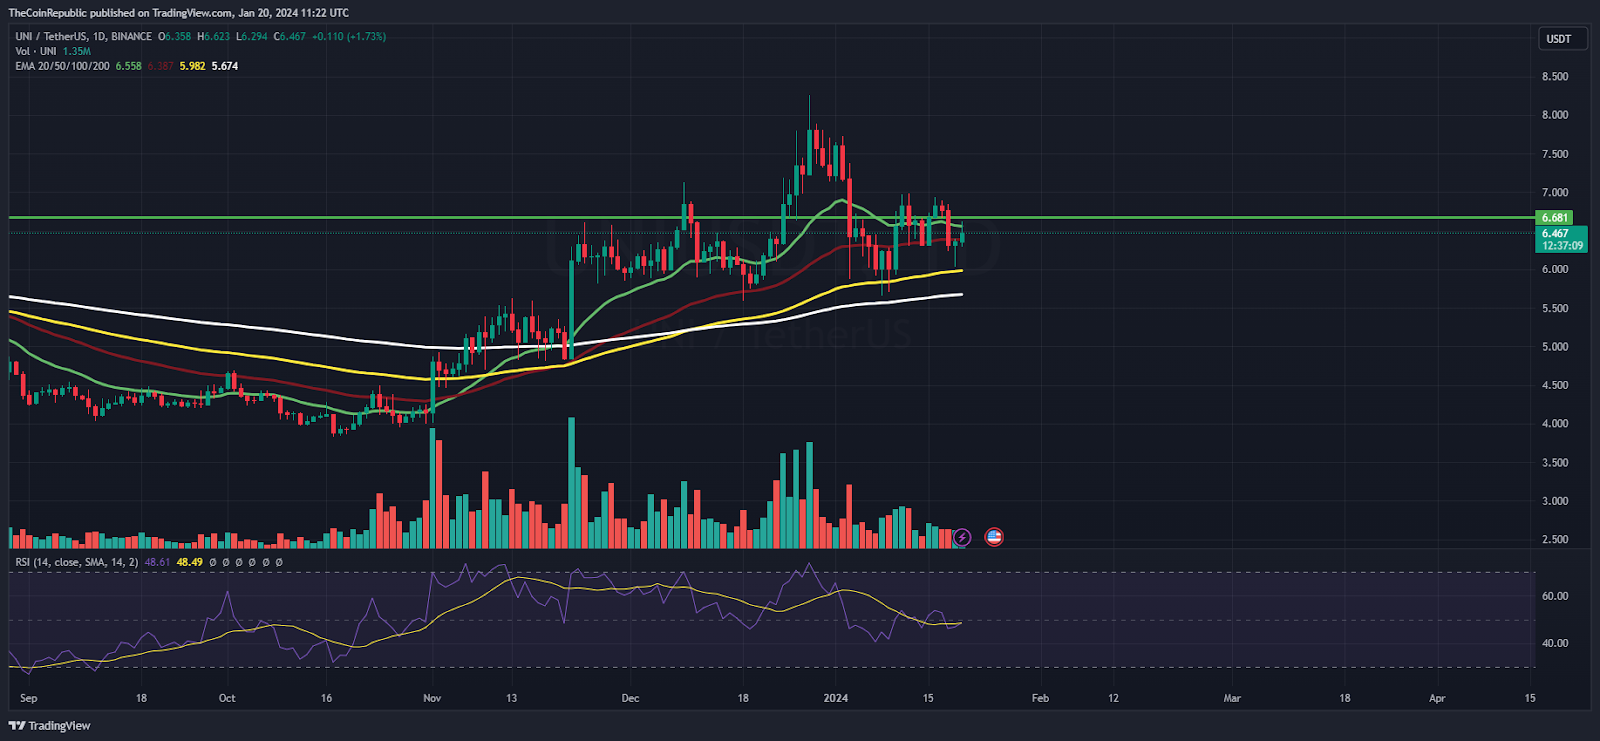
On the daily charts, Uniswap crypto reveals a sideways move amidst the uptrend and is hovering near the 50-day EMA. Moreover, the price action exhibits volatility and fake moves, a trap for investors. Meanwhile, the chart depicts the bearish sign, which may activate soon and reflect the down move soon.
The Relative Strength Index (RSI) curve stayed below the midline and showed a negative divergence, reflecting the volatility. However, the MACD indicator shows a bullish crossover, which reveals a neutral view.
UNI on Weekly Charts Depicts Rejection from the 100-Day EMA
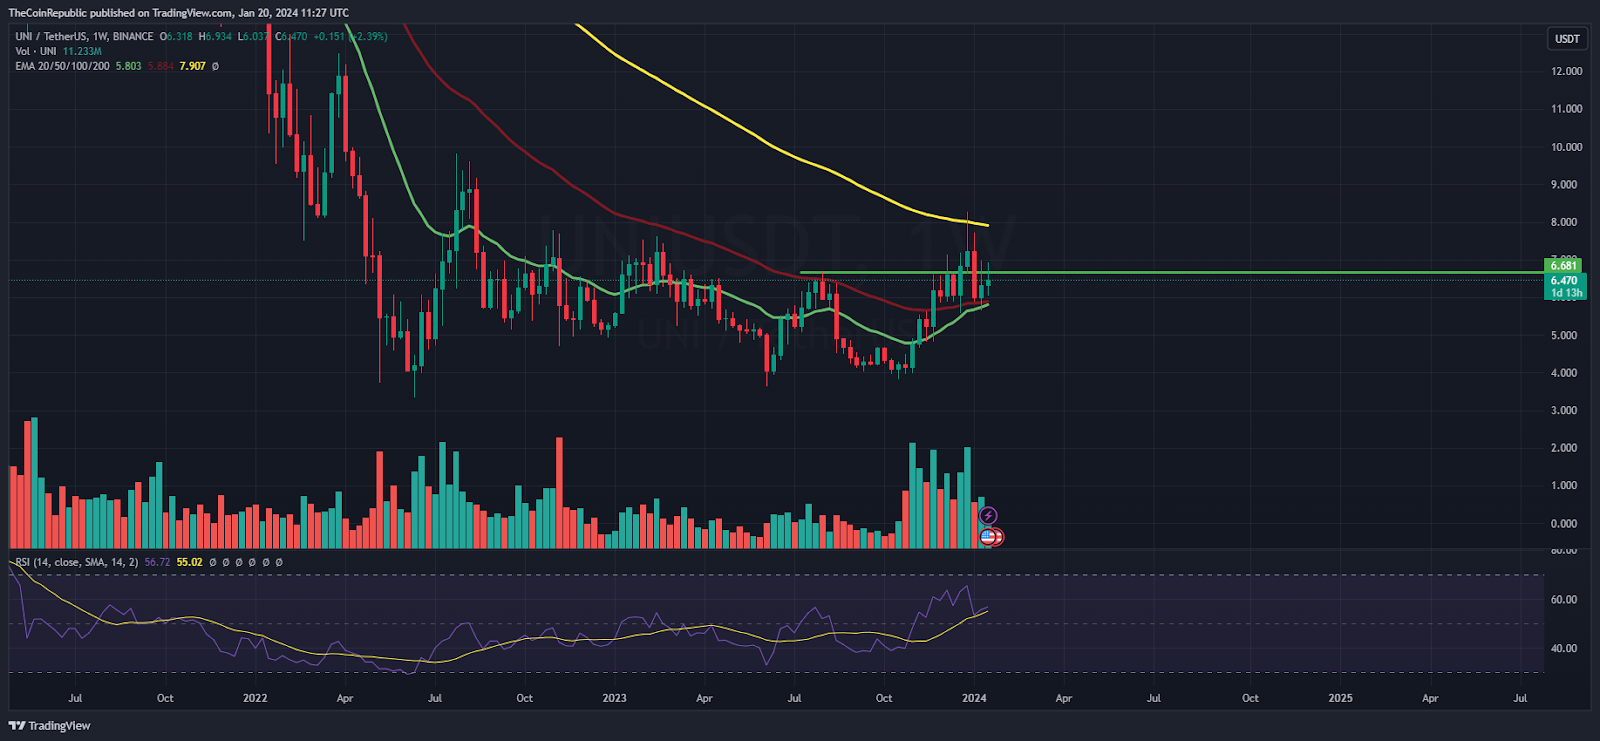
On the weekly charts, Uniswap crypto split the downward-sloping trendline above $5.50, reaching the supply zone of $8 near the 100-day EMA mark. However, the token failed to sustain the gains and faced a sharp rejection, which impacted the bulls.
Summary
The Uniswap (UNI) token has managed to sustain the gains and showcased a pullback from the 100-day EMA. However, the chart tells something different, highlighting a pause before the disaster. The sellers are still in the race and are trying to breach $6 to continue the fall.
Technical Levels
Support Levels: $6.20 and $6
Resistance Levels: $6.80 and $7
Disclaimer
The views and opinions stated by the author or any other person named in this article are for informational purposes only and do not constitute financial, investment, or other advice. Investing in or trading crypto or stocks comes with a risk of financial loss.

Amanda Shinoy is one of the few women in the space invested knee-deep in crypto. An advocate for increasing the presence of women in crypto, she is known for her accurate technical analysis and price prediction of cryptocurrencies. Readers are often waiting for her opinion about the next rally. She is a finance expert with an MBA in finance. Quitting a corporate job at a leading financial institution, she now engages herself full-time into financial education for the general public.


