
 Home
Home News
News
- 1 FXS token price is in an uptrend and is forming an ascending triangle pattern.
- 2 Buyers are trying to uplift the token above the neckline barrier of $10.
The Frax Share (FXS) token reflects a pullback from the 200-Day EMA mark and has regained strength in recent sessions. However, the bulls did not sustain above $10 and displayed a rejection wick. Afterward, the price consolidated near the breakout zone and is waiting to cross the zone. Amidst the positive market sentiments, Frax Share (FXS) price has persisted in accumulation and recovered over 70% of gains in the past weeks.
The FXS token has climbed above the significant moving averages and is bullish, replicating the favorable outlook for the following sessions. The trend is intact, and buyers attempted to escape the immediate hurdle of $10 to register a breakout. The price action shows higher high swings and the token is still decisively carrying the gains.
This cryptocurrency trades at $9.247 at press time, with an intraday gain of 3.20%, showing a pullback from the 200-Day EMA. Moreover, the trading volume increased by 5.19% to $31.31 Million, highlighting a bullish bias. The pair of FXS/BTC was noted at 0.000222 BTC, while the market cap is $1.66 Billion. Analysts are bullish and suggest that the Frax Share will continue to lift the gains and may escape $10 in the upcoming sessions.
FXS On Daily Chart Displays Ascending Triangle Pattern
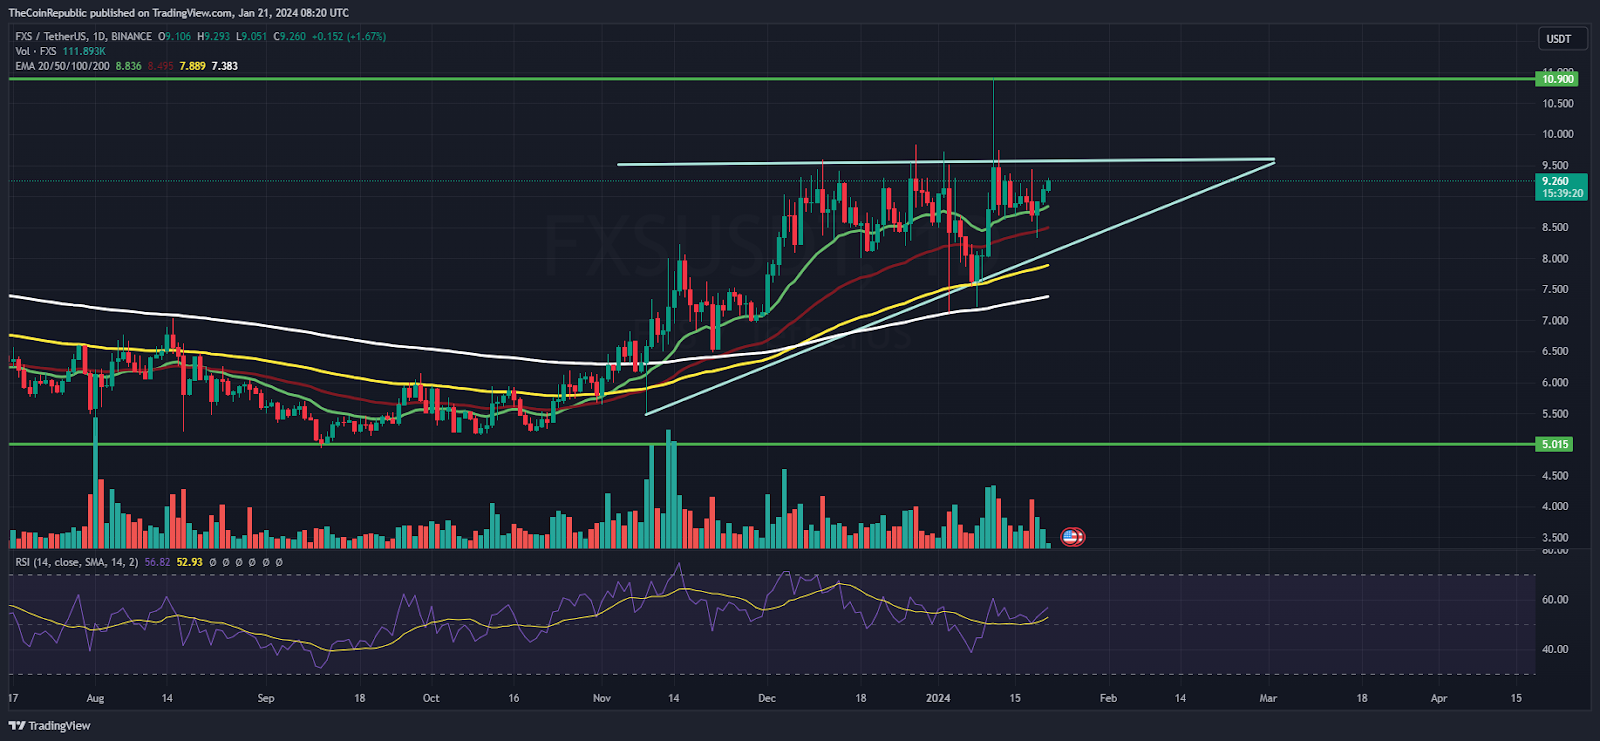
On the daily chart, the FXS token is trading in an uptrend and is on the verge of a breakout near $10. Meanwhile, the buying momentum was average, delaying the up move; investors are waiting for a breakout and are examining past sessions.
The relative strength curve stayed near the midline and showed a positive divergence, directing the bullish bias. Moreover, the MACD indicator shows a bullish crossover and formed green bars on the histogram, suggesting the outperform outlook for the following sessions.
FXS On Weekly Chart Displays Rejection At 100-Day EMA
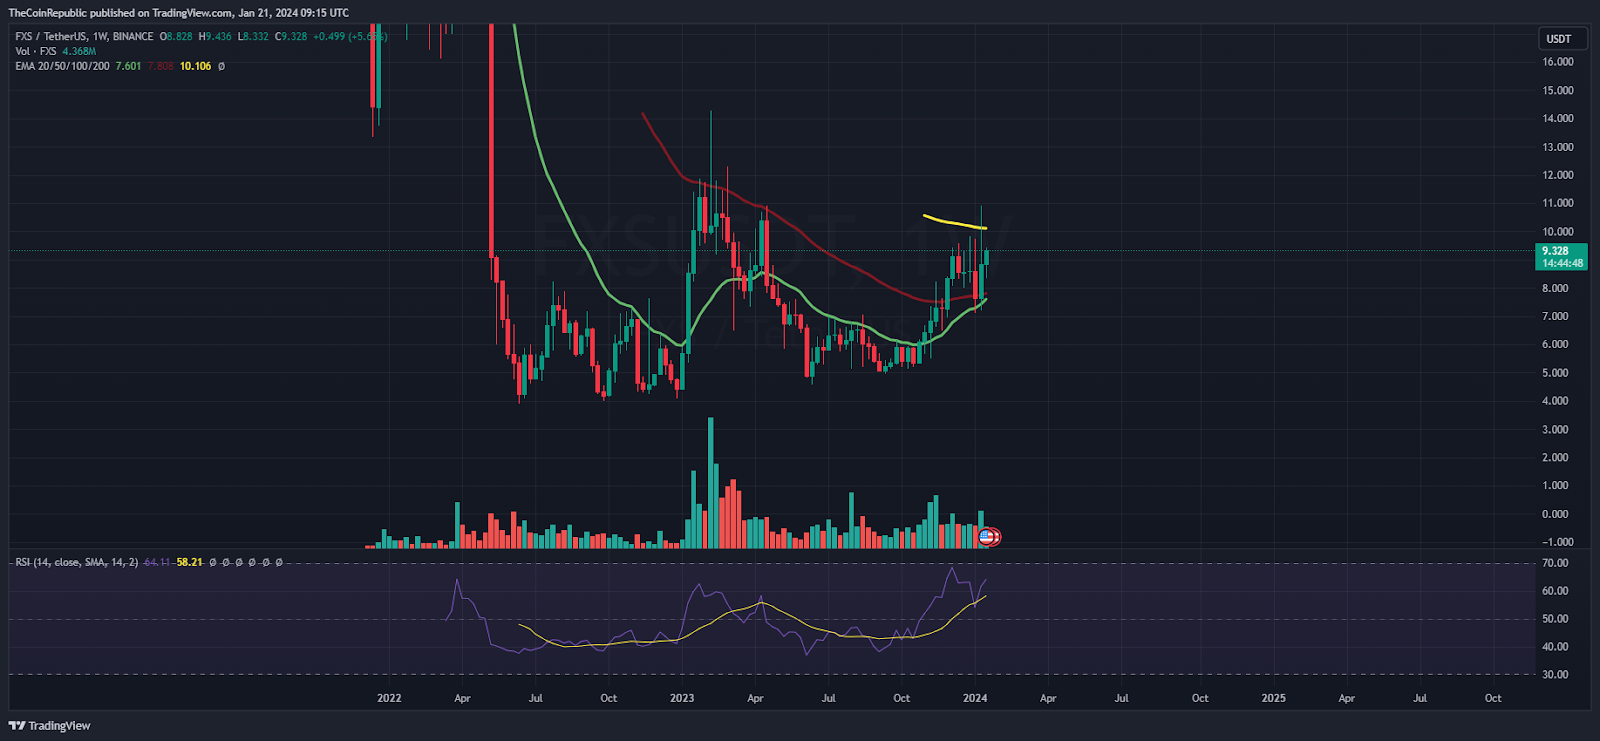
On the weekly chart, FXS formed a double bottom pattern and reverted from the bottom of $4. Afterwards, the buying momentum continued and the token did not drain the gains and persisted in extending the up move. The Fib level implies that a token has sustained above 38.2% and is close to the 50% mark.
Summary
Frax Share (FXS) token was in an uptrend and is ready to shine the gains above the resistance mark of $10. Meanwhile, the bears try their best to protect the region, but the technical indicators signal a blast, which may be seen shortly.
Technical Levels
Support Levels: $9 and $8.80
Resistance Levels: $10 and $10.60
Disclaimer
The views and opinions stated by the author or any other person named in this article are for informational purposes only and do not constitute financial, investment, or other advice. Investing in or trading crypto or stocks comes with a risk of financial loss.

With a background in journalism, Ritika Sharma has worked with many reputed media firms focusing on general news such as politics and crime. She joined The Coin Republic as a reporter for crypto, and found a great passion for cryptocurrency, Web3, NFTs and other digital assets. She spends a lot of time researching and delving deeper into these concepts around the clock, and is a strong advocate for women in STEM.


