
 Home
Home News
News
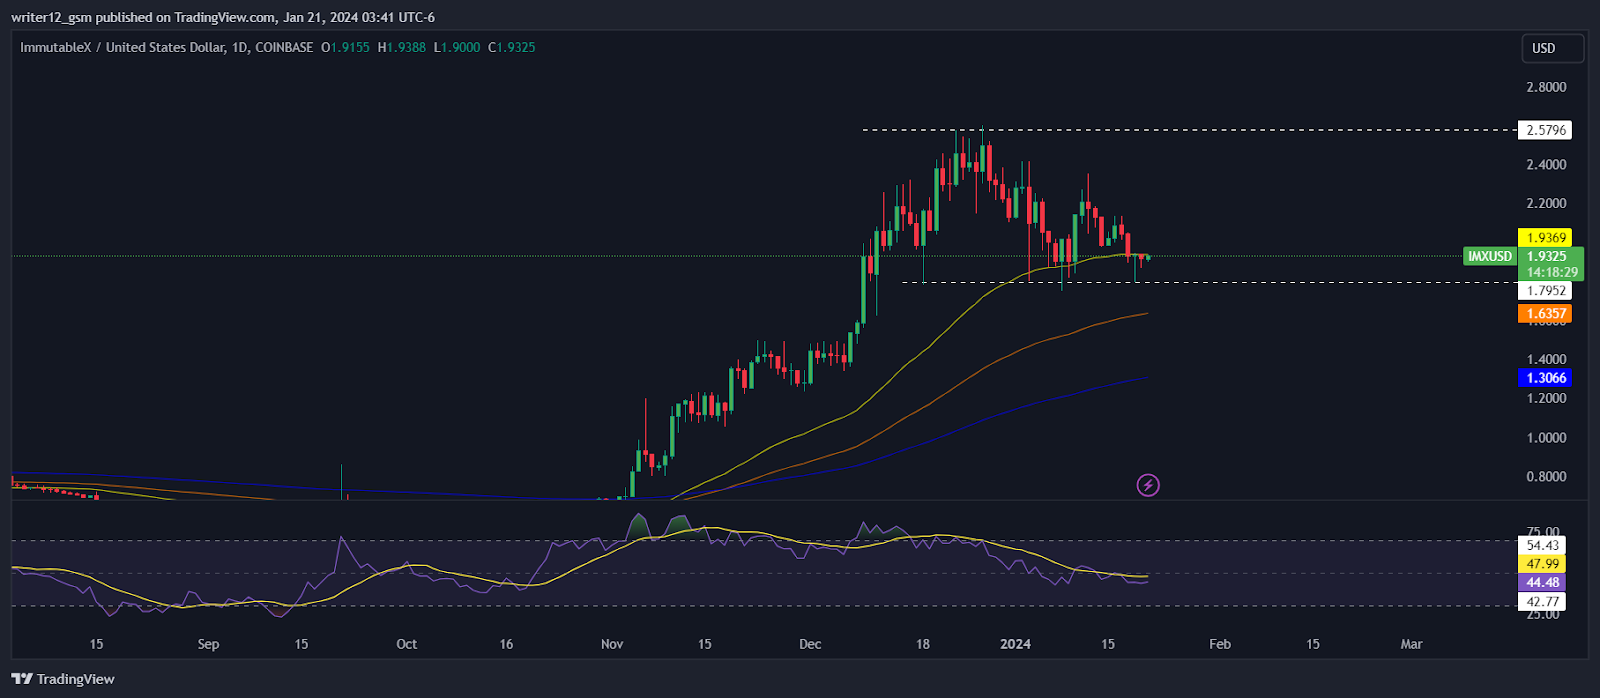
- 1 ImmutableX price has broken below the 50-Day EMA, showcasing a downtrend.
- 2 IMX price is facing bearish pressure on the daily chart.
ImmutableX price is facing bearishness on the daily chart. It halted near $2.5 and resumed the downtrend breaking below the 20 and 50-Day moving averages.
ImmutableX price prediction indicates that the ImmutableX crypto may see further depreciation in its value within the next few weeks amid bearish pressure on the daily chart. Presently, the ImmutableX price is down by 9.45% over the past seven days and as per the price action, it is facing bearish dominance.
Currently, the sellers are in charge of the trend where they maintain firm command over the price action. However, the buyers are trying to take control. Despite the bearish dominance, the buyers are trying to sustain at the current levels, and bears regained supremacy over the price action on the 1-Day chart.
IMX crypto price is trading under the key exponential moving averages within the bear’s grasp. The price is confronting resistance from the 50-Day EMA at present on the daily timeframe. The price is facing substantial selling pressure in the supply zone which indicates that bears may push its value in a downward direction further shortly.
The technical indicators suggest that sellers hold the edge over the price action against buyers. The price pattern, oscillators, EMA’s, and Volume are moving in tandem, giving selling signals.
At the time of writing, IMX is trading at $1.9302 with an intraday gain of 0.66%, signaling bearishness. Moreover, the trading 24-hour volume is 38.54 Million and the current market cap is 2.552 Billion.
Technical Analysis of ImmutableX Crypto Price in 1-D Timeframe
At the time of publishing, ImmutableX crypto (USD: IMX) is trading above the 100 and 200-Day EMAs (exponential moving averages), which are supporting the price trend.
However, if selling increases the price might touch lower levels by making lower highs and lows. Therefore, the IMX price is expected to move downwards giving a negative outlook over the daily time frame chart.
The current value of the RSI curve is 44.57 points. The 14 SMA is above the median line at 47.99 points which indicates that the ImmutableX crypto is heading into a negative zone giving a bearish outlook.
The MACD line at -0.0346 and the signal line at -0.0076 are close to the zero line. A bearish crossover is observed in the MACD indicator which signals more bearishness for the IMX crypto price.
Summary
The technical indicators of ImmutableX (USD: IMX) are suggesting a downward trend. The MACD, RSI, and EMAs are giving negative signals and suggest that the IMX crypto price may keep falling. ImmutableX price movement indicates that the market is pessimistic on the 1-D chart. The market sentiment is bearish right now. The current situation demands that traders and investors wait for a clear signal below or above the range before taking any action and avoid the fear of missing out to reduce losses.
Technical Levels
Support Levels: $2.5796
Resistance Levels: $1.7952
Disclaimer
This article is for informational purposes only and does not provide any financial, investment, or other advice. The author or any people mentioned in this article are not responsible for any financial loss that may occur from investing in or trading. Please do your own research before making any financial decisions

Amanda Shinoy is one of the few women in the space invested knee-deep in crypto. An advocate for increasing the presence of women in crypto, she is known for her accurate technical analysis and price prediction of cryptocurrencies. Readers are often waiting for her opinion about the next rally. She is a finance expert with an MBA in finance. Quitting a corporate job at a leading financial institution, she now engages herself full-time into financial education for the general public.


