
 Home
Home News
News
- 1 The SOPR metric and Bitcoin or other popular cryptocurrency prices are observed to have positive correlation.
- 2 The SOPR metric can act as a threshold to determine the direction of price movement in crypto market.
- 3 The SOPR is used as an indicator that reflects the degree of profit or loss of an asset.
The Spent Output Profit Ratio (SOPR) is a ratio that evaluates the profit ratio of all market participants by comparing the value of outputs at the time spent to the time created. In different words, the user can estimate whether the distribution of spent transaction output is profitable or not.
This ratio may be used to determine whether the selling price of an asset is higher or lower than its buying price. If the selling price is better than the buying price, it states that the asset is sold at a profit or a vise-a-versa.
SOPR is typically observed on a daily basis and is used to evaluate the profit or loss within a day for assets. Renato Shirakashi created the Spent Output Profit Ratio for the first time.
SOPR provides valuable insights about investor behavior by evaluating the profitability of popular cryptocurrency transactions.
Calculation of SOPR
SOPR is calculated as the USD value of spent outputs at the spent time (realized value) divided by the USD value of spent outputs at the created time (value at creation).
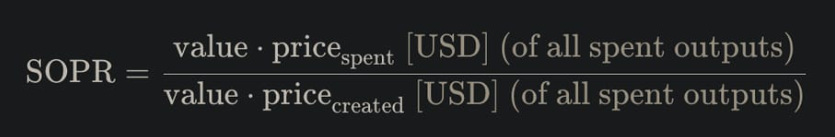
Value is the circulating supply of the asset within a specific time period (typically on a daily basis).
Price (spent) is the selling price of the asset.
Price (created) is the buying price of the asset.
Steps for Calculating SOPR
The Spent Output Profit Ratio (SOPR) observes the ratio between the fiat currency value when the UTXO (Unspent Transaction Output) was created and the fiat value when the UTXO is spent. A UTXO, importantly, refers to a wallet balance.
UTXO is transferred and then locates the USD value of the spent period and divides it by the USD value at the created time. SOPR = current value/ past value. Then, the results are analyzed to infer meaningful studies from SOPR.
Performance Metric
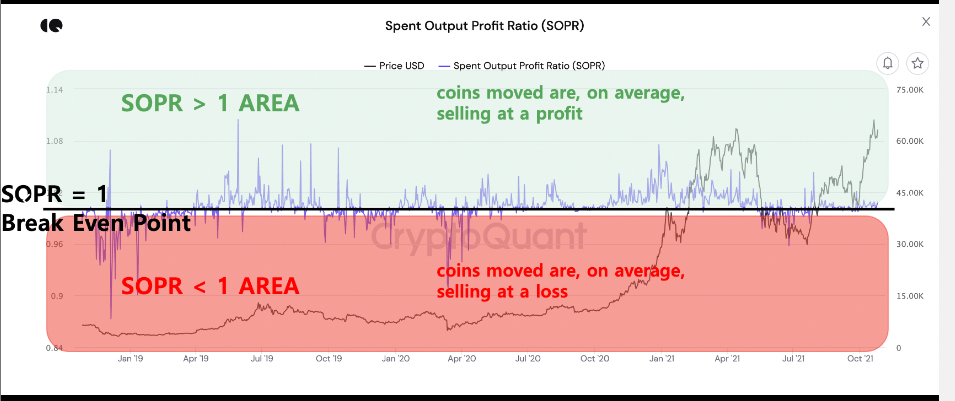
SOPR greater than 1 (SOPR > 1)
If the calculated number of SOPR is more than 1, then it may be ascertained that, on average, the active assets within a day were sold at a profit. Stated differently, the selling price of assets was higher than the buying price.
SOPR lesser than 1 (SOPR < 1)
If the calculated number of SOPR is lower than 1, then, on average, the active assets within a day were offered at a loss, that is, the selling price of assets was less than the buying price.
SOPR greater than 1 (SOPR > 1) and Continuously rising
If the calculated value of SOPR is greater than 1 and is continuously rising, then it can be interpreted that asset prices are increasing consistently and that markets are usually profitable. Moreover, it indicates that markets are approaching the high mark, and a sell signal is generated.
SOPR lower than 1 (SOPR < 1) and Continuously declining
If the calculated value of SOPR is less than 1 and is following a decreasing trend, then the asset prices are continuously decreasing and users are constantly making losses in the market. Additionally, it indicates that the markets are approaching low and a buy signal is generated.
Extensions of SOPR
aSOPR
For practical analysis, a variant of SOPR called aSOPR is usually used to improve analysis accuracy. aSOPR stands for adjusted SOPR. aSOPR excludes transactions with a duration of less than one hour.
It enhances the visibility of market profit and loss situations and market trends while providing clearer buy/sell signals.
STH-SOPR
STH-SOPR stands for Short Term Holder – SOPR (Spent Output Profit Ratio). It is a variant of SOPR that only takes into account the spent output that is younger than 155 days.
It serves as an indicator for assessing the behavior and profitability of investors who are more likely to be new to the market.
LTH-SOPR
LTH-SOPR stands for Long Term Holder – SOPR (Spent Output Profit Ratio). It is a variant of SOPR that takes into account the spent output that is older than 155 days.
It serves as an indicator for assessing the behavior and profitability of smart- money investors who have a greater fundamental understanding of the asset and more experience in market volatility.
SOPR Value History
Initially, the calculated number of SOPR ranged between 1.04 and 1.07 suggesting a high in the market, whereas the value of SOPR between 0.88 and 0.96 suggests a low in the market.
For instance, on November 10, 2022, the price of Bitcoin dropped to $16,000, leading to a speedy decrease in SOPR from 0.99 to a significant low of 0.87. The reason for this sudden decrease was an FTX bankruptcy incident. After hitting the low, the price of the Bitcoin gradually recovered and reached above $20,000.
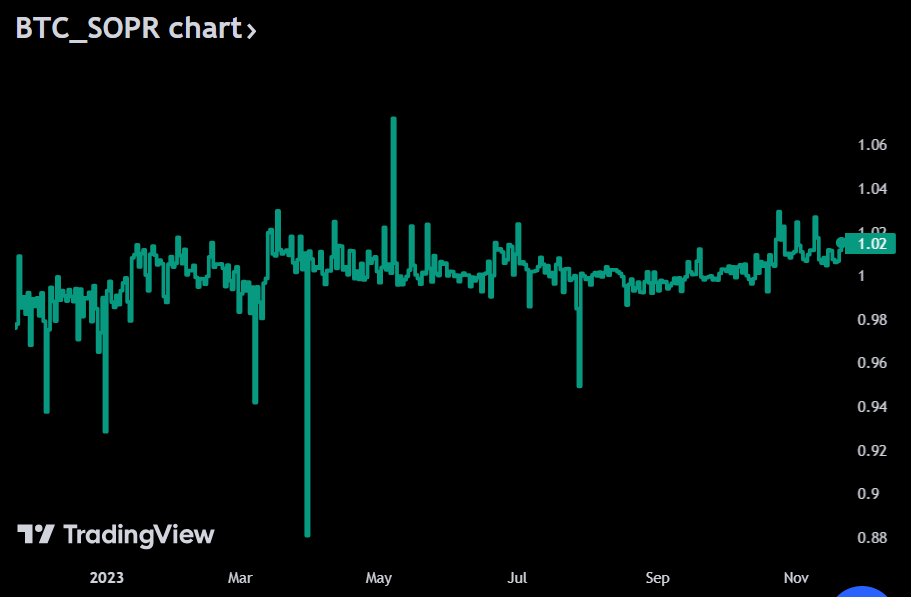
The current 1 year BTC SOPR chart is trending upward and has a current value greater than 1 (1.02).
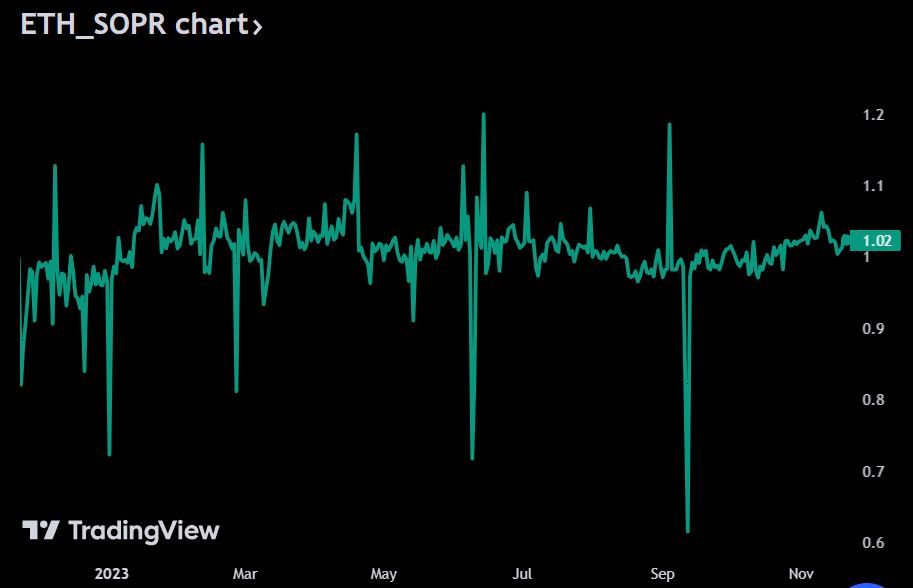
The current 1 year ETH SOPR chart also has a value greater than 1, reflecting a bullish trend. ETH SOPR has a higher variation than BTC SOPR.
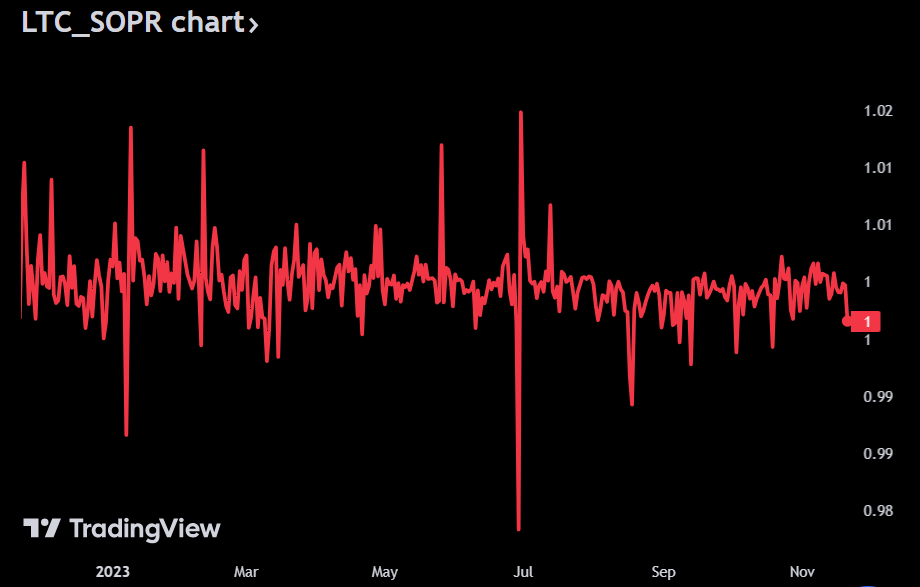
The current 1 year LTC SOPR chart reflects a bearish trend with a value equal to 1 and is expected to decline further.
Conclusion: Utility of SOPR
The Spent Output Profit Ratio is useful because it provides exposure to actual market participant behavior at a given moment in time. So, it can act as a useful market sentiment tool.
If the SOPR is negative, significant losses are being realized, and those losses are increasing across several days. This is a signal to users that most of the participants are fearful and expect the prices to drop further.
The positive trend in SOPR reflects the bull trend in the market and is an opportunistic time to buy for informed investors.

Steefan George is a crypto and blockchain enthusiast, with a remarkable grasp on market and technology. Having a graduate degree in computer science and an MBA in BFSI, he is an excellent technology writer at The Coin Republic. He is passionate about getting a billion of the human population onto Web3. His principle is to write like “explaining to a 6-year old”, so that a layman can learn the potential of, and get benefitted from this revolutionary technology.


