


CME Group Inc. (NASDAQ: CME) stock displayed a retracement and retested the round mark of $200 in the recent sessions. However, a pullback was witnessed and stock again caught the 200-day EMA mark near $203. The trend is neutral and the stock reveals volatility in the past sessions. If the stock succeeds in escaping $208, it might give confirmation of an uptrend. If it slips below $196, it will go toward the low of $180.
The CME stock is trading near the crucial mark of $200, which is the ideal support zone and a pullback was also witnessed. Moreover, the chart shows a rising wedge breakdown and the stock is hovering below the major hurdle of $210. The price action signifies the uncertainty among the investors who are waiting for a clear move above the aforementioned levels to make fresh positions.
At yesterday’s close, the CME stock was at $203.27 with an intraday gain of 0.66% showing a neutral outlook. Moreover, the technicals are strong and suggest a technical buy outlook. However, Analysts are neutral and give a yearly target price of $218.53 which was retested recently.
CME on Daily Charts Displays Neutrality
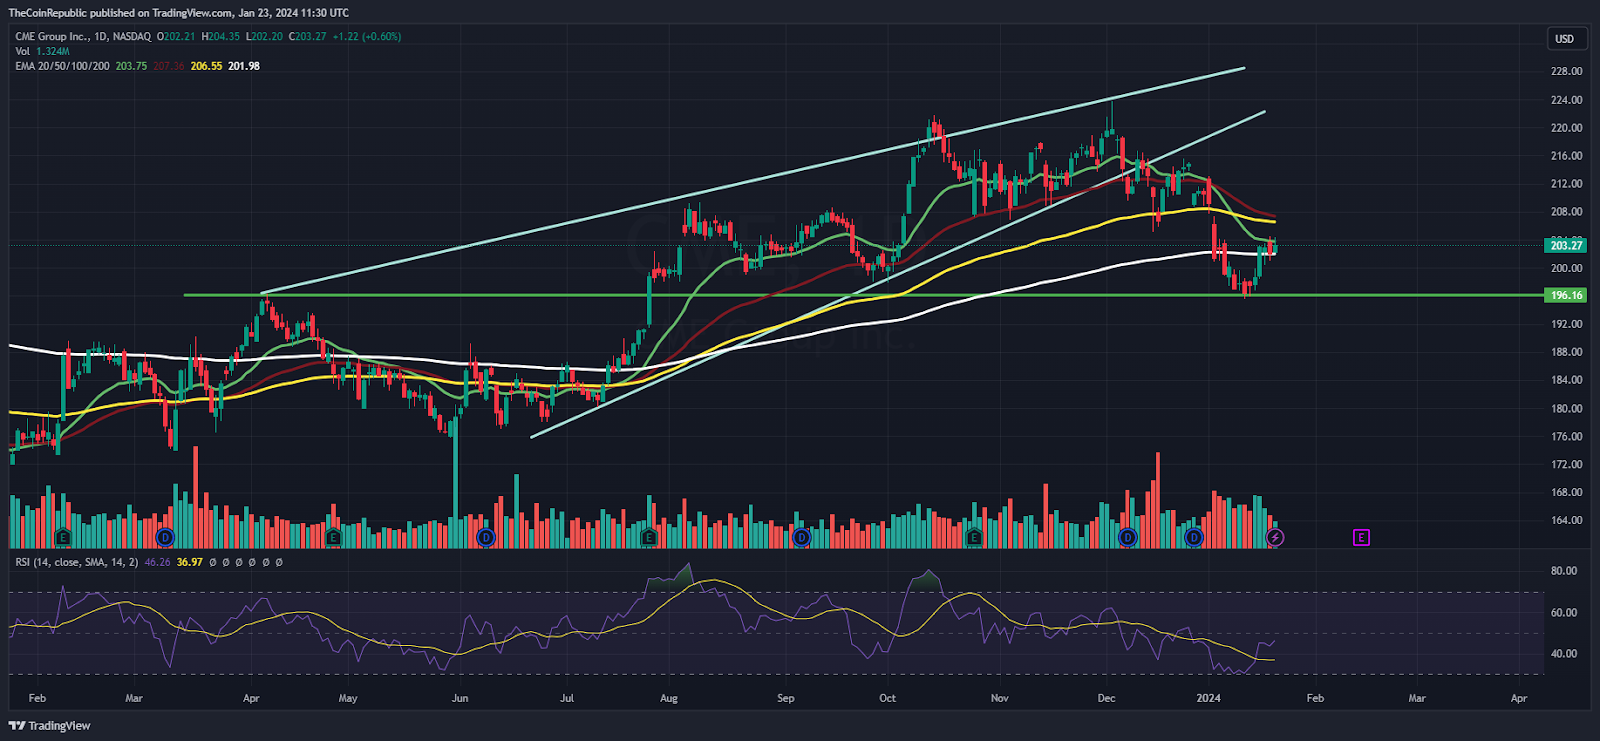
On the daily charts, the stock forms an inside candle near the 100-day EMA and is suggesting a rebound toward $210 soon. The stock has retested its 38.2% Fib zone and pulled back decisively. It indicates the buying momentum is still valid and buyers will soon lift the stock above the bars.
The relative strength index (RSI) curve rose toward the midline from the oversold region and replicated a rebound in the recent sessions. The MACD indicator shows a bullish crossover and formed green bars on the histogram, suggesting a neutral outlook per the technical setup.
Per the option chain data, short buildup activity was witnessed and sellers have added fresh short positions at the strike price of $205, where the open interest increases to 419 hundred shares reflects a prompt resistance zone.
CME On Weekly Charts Exhibits Volatility
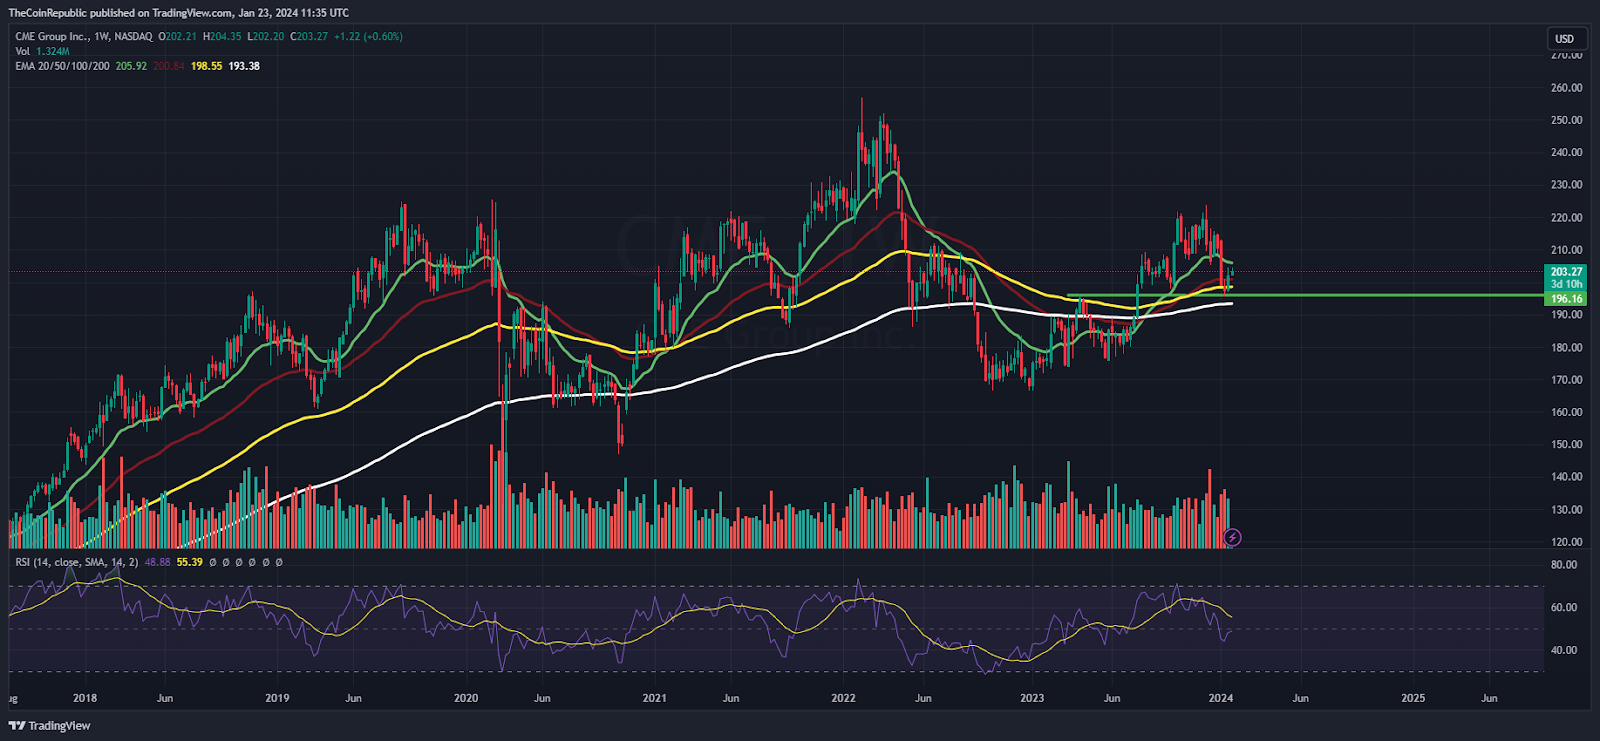
On the weekly charts, CME Group Inc. (NASDAQ: CME) has retested its bottom support zone and is showing volatility in the recent sessions. However, the stock has taken support on the 20-day EMA mark and is displaying indecisiveness among the bulls and bears. Per the technicals, the stock did not indicate any bounce further and may retest the lows of $190 soon.
Summary
CME Group Inc. (NASDAQ: CME) stock is trading near its round support zone of $200 and reflects profit booking in the recent sessions. However, the stock is yet to surpass the 20-day EMA mark above $205 and is waiting for a clear view.
Technical Levels
Support Levels: $200 and $196
Resistance Levels: $207 and $210


