
 Home
Home News
News

- 1 GALA token slips below the 200-day EMA mark and is displaying a selloff.
- 2 Bears have gained momentum and are forcing the token toward $0.02000.
The GALA token shows a distribution from the top and is displaying a death crossover, replicating underperformance in recent sessions. Moreover, the token is reflecting a rounding top pattern and has slipped below the key moving averages which exhibits a fresh selloff. The token is heading to its round mark of $0.02000, where bulls might hold the gains.

The GALA token is displaying selling pressure and a bearish crossover indicates the downtrend on the charts. Moreover, the token is signaling that the buyers have booked their gains and sellers are getting interested in stretching the token below $0.02000 to spread the downfall. The trend is favoring the bears and the following selling pressure may continue in the following sessions.

This cryptocurrency’s price was $0.02090 at press time, with an intraday drop of 8.27%, showing a bearish outlook. Moreover, the trading volume increased by 11.22% to $88.60 Million, highlighting selling pressure. The pair of GALA/BTC was noted at 0.0000537 BTC, while the market cap is $157.98 Million. Analysts are bearish and suggest that the token will breach $0.02000 soon.
GALA on Daily Charts Displays Breakdown
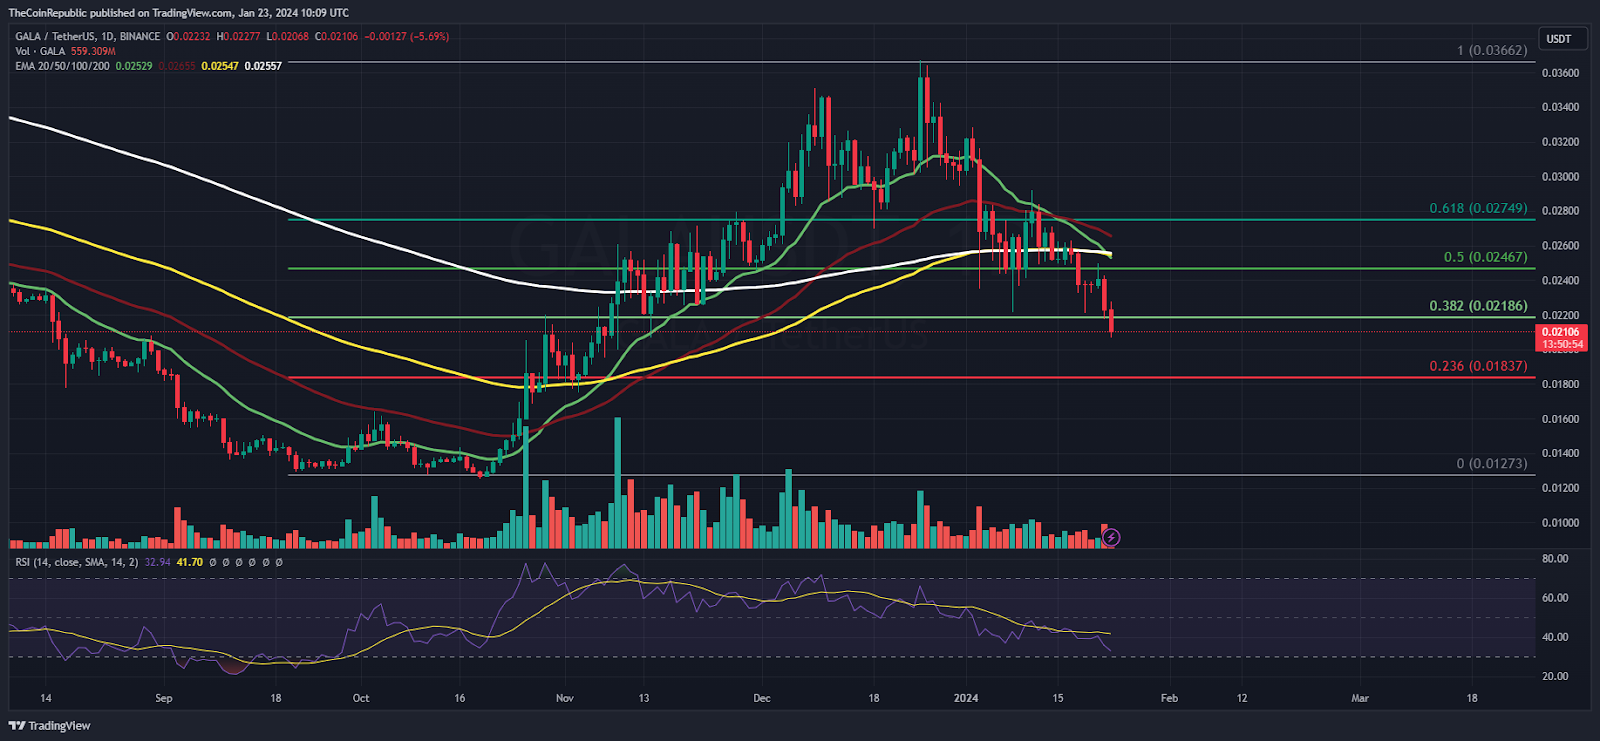
On the daily charts, the token shows a fresh breakdown below its crucial support zone of $0.02500 and exhibits a breakdown. Moreover, the price action showcases the distribution and has slipped below the 38.2% Fib zone. The token is likely to spread the downfall toward the 23.6% zone and may retest $0.01800 soon. The token has faced the trendline hurdle of $0.02800 in recent sessions and rolled back to its origin.
The relative strength index (RSI) curve stayed below the midline in the oversold region and is displaying a negative divergence. The MACD indicator showed a bearish crossover and reflected a bearish crossover, indicating the bears’ dominance.
GALA On Weekly Charts Exhibits Rejection from the 50-Day EMA
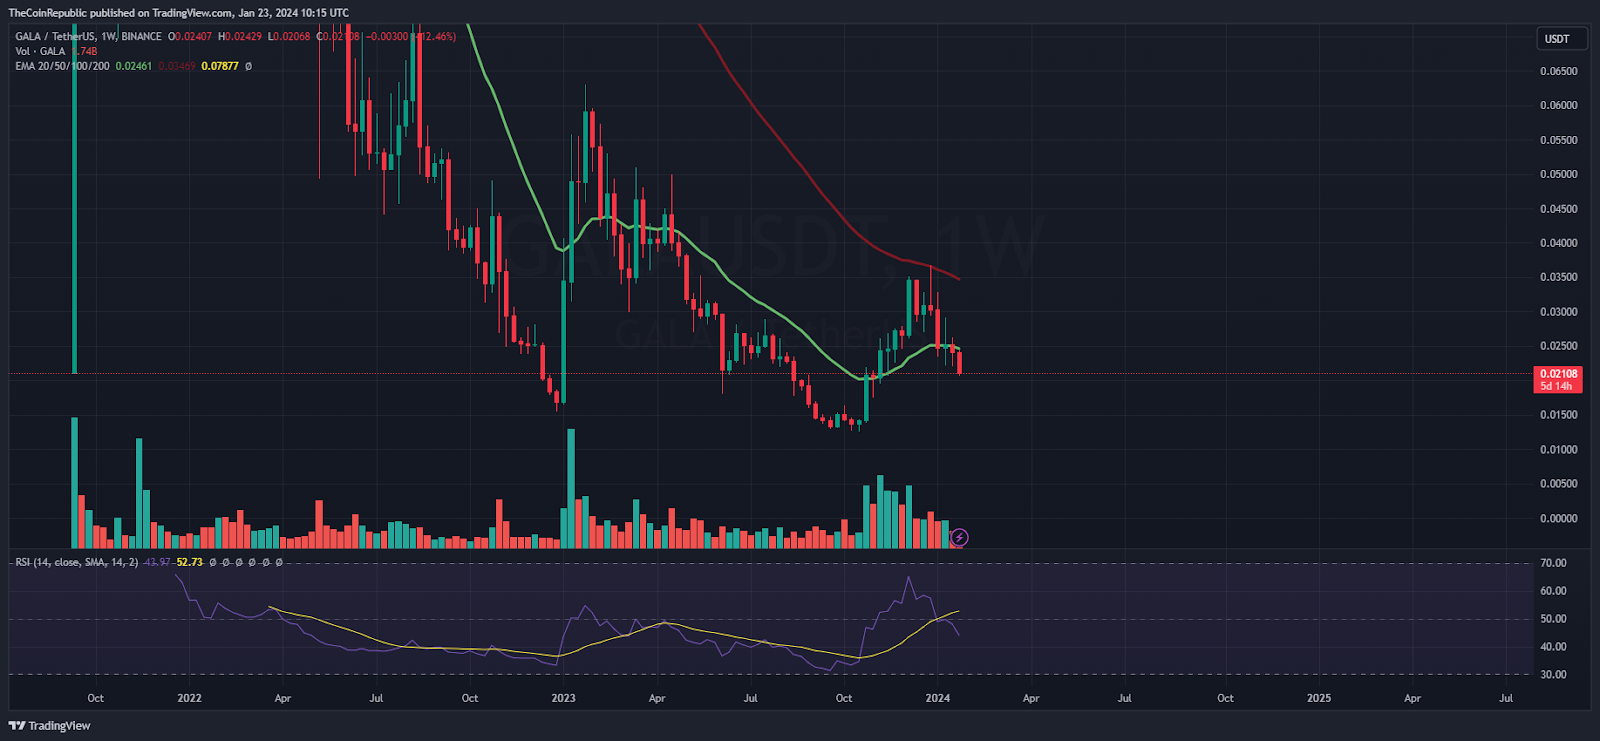
On the weekly charts, the token has persisted in forming the lower lows and displayed a sharp rejection from the 50-day EMA mark. Furthermore, the reversal was intense and the token failed to halt the gains near the important zone of $0.02500 and slipped below the 20-day EMA.
Summary
The GALA token has slipped below the neutral region and is heading to the bearish trajectory spreading the selloff. The token failed to sustain itself at the top and exhibited a sharp rejection which showed the bears’ dominance. Moreover, the token has an immediate support zone of $0.02000, which is the make-or-break region.
Technical Levels
Support Levels: $0.02000 and $0.01800
Resistance Levels: $0.02200 and $0.02400
Disclaimer
The views and opinions stated by the author or any other person named in this article are for informational purposes only and do not constitute financial, investment, or other advice. Investing in or trading crypto or stocks comes with a risk of financial loss.

Adarsh Singh is a true connoisseur of Defi and Blockchain technologies, who left his job at a “Big 4” multinational finance firm to pursue crypto and NFT trading full-time. He has a strong background in finance, with MBA from a prestigious B-school. He delves deep into these innovative fields, unraveling their intricacies. Uncovering hidden gems, be it coins, tokens or NFTs, is his expertise. NFTs drive deep interest for him, and his creative analysis of NFTs opens up engaging narratives. He strives to bring decentralized digital assets accessible to the masses.


