
 Home
Home News
News

- 1 The TIA token is trading near the trendline support of $15 and is showing selling pressure.
- 2 Buyers have lost their momentum and are struggling to hold the gains.
The TIA (Celestia) token displayed an uptrend and persisted in forming higher high swings amid the volatile market. However, the TIA token is now reverting its direction and facing selling pressure in the recent sessions. The token is now hovering around $15 and has slipped below the 20-day EMA, directing the retracement from the top of $20. Additionally, the token has noted a major run and the investors are taking their profits which led to a mild decline.

Celestia (TIA) shows a trend reversal and is hovering near the trendline support zone of $15 and is forming a doji candlestick. Moreover, the price action reflects the selling pressure and the buyers have tried to sustain the gains, but failed to hold. However, the token is still trading above the 50-day EMA, reflecting the neutrality on the charts.

This cryptocurrency price was $15.72 at press time, with an intraday drop of 6.13%, showing a bearish outlook. Moreover, the trading volume increased by 10.60% to $262.78 Million, highlighting retracement. The pair of TIA/BTC was noted at 0.000381 BTC, while the market cap is $2.13 Billion. Analysts are neutral and suggest that the TIA token will face volatility in the next sessions and may retest $14.20 soon.
TIA on Daily Charts Reflects Reversal from Top
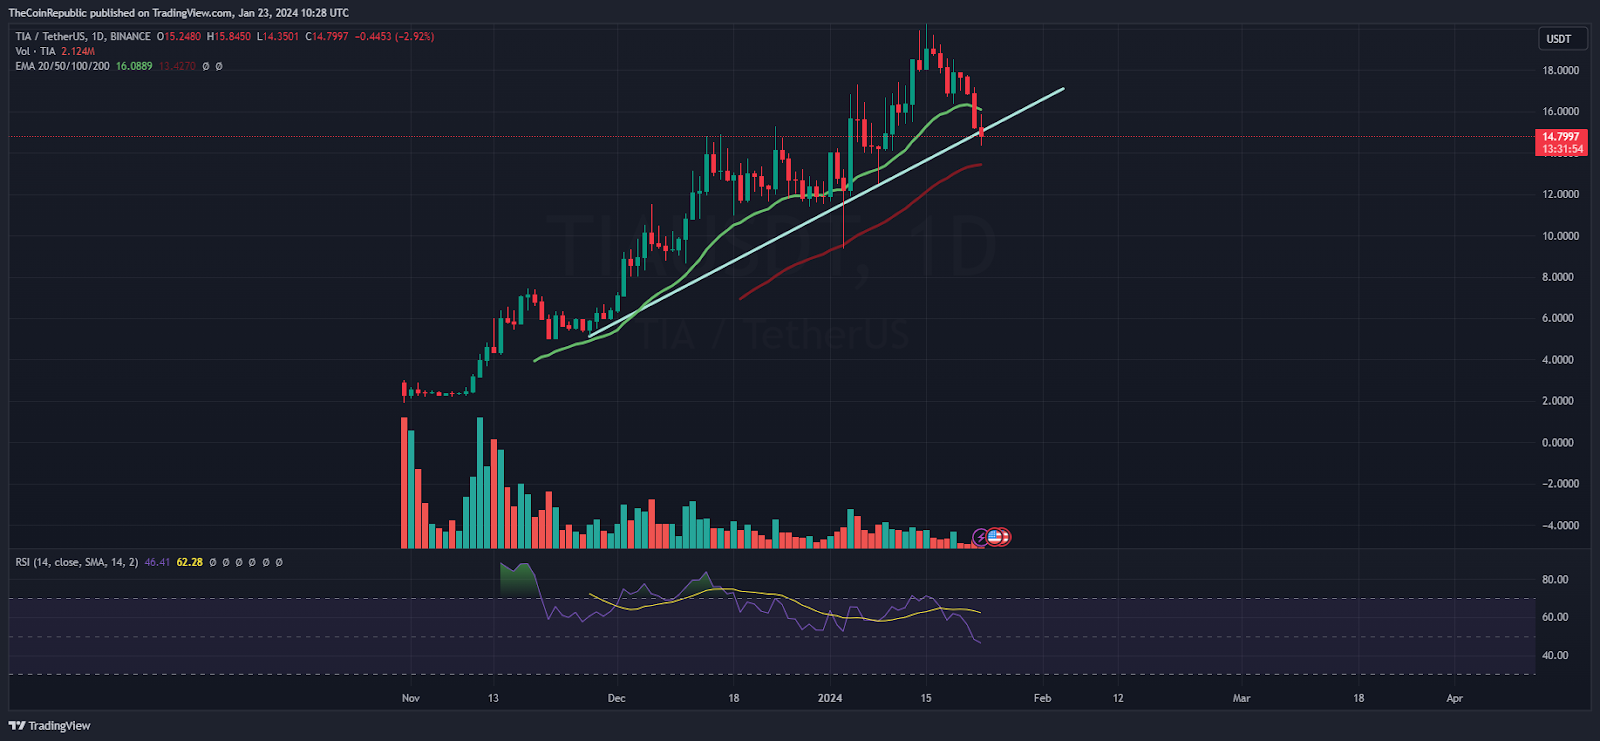
On the daily charts, the TIA price slipped below the support mark of $15 and is replicating selling pressure in the last sessions. Moreover, the token is under the observation of bears and they are adding fresh short positions that lead bulls in trouble. The token has slipped below the 50% Fib zone and may retest the 38.2% zone near $13.50 shortly.
The Relative Strength Index (RSI) curve slipped to the oversold region, depicting a negative crossover. The MACD indicator shows a bearish crossover and formed red bars on the histogram, suggesting that sellers may spread the fall and the token may retest $14 soon.
TIA On Hourly Charts Displays Channel Breakdown
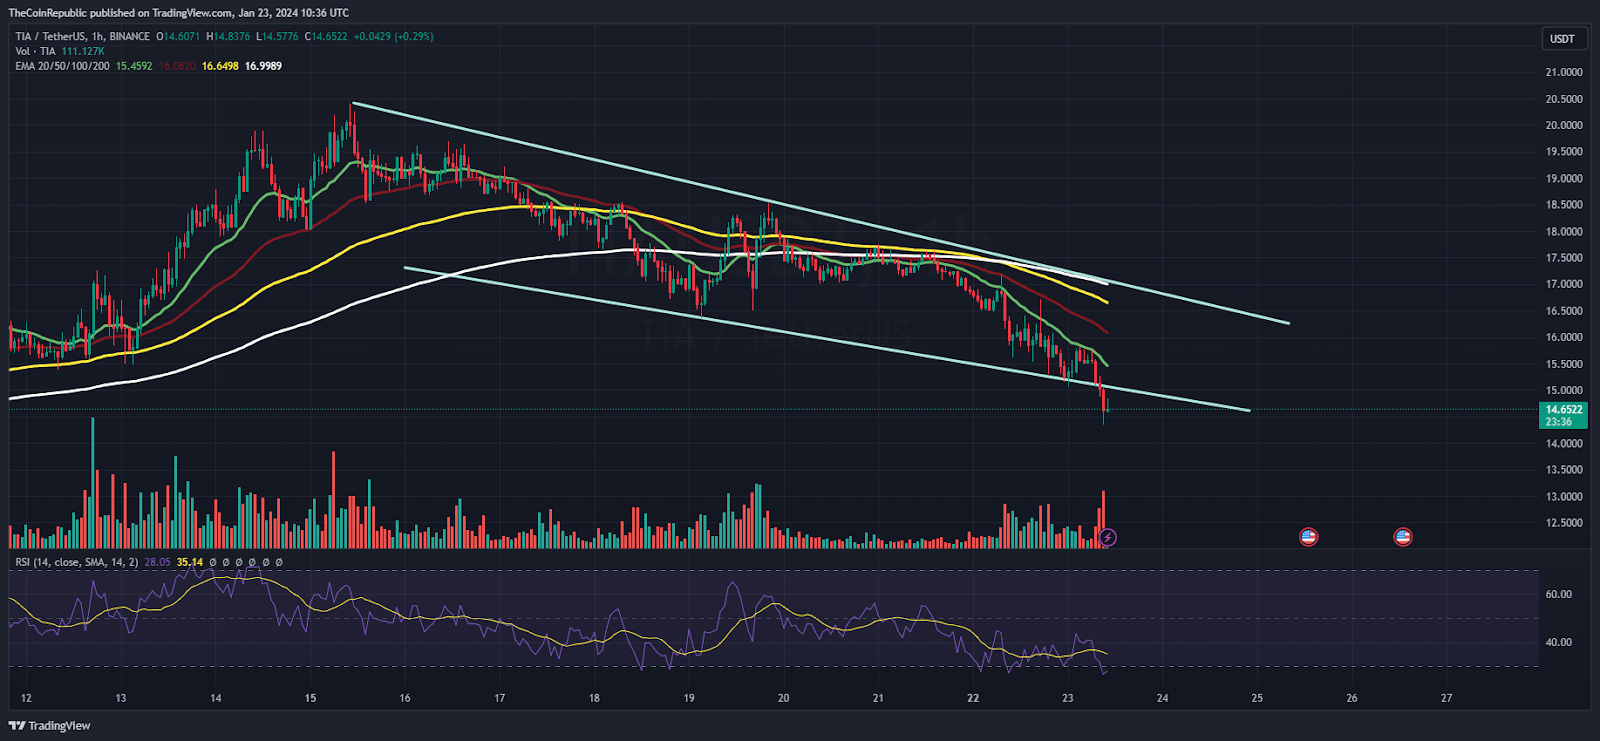
On the hourly charts, TIA crypto has exited the channel lows and delivered a breakdown in the last sessions. In the past sessions, TIA crypto has persisted in forming the lower lows inside the falling channel and is finally taking a direction.
The price action delivers the selling pressure and the token may carry forward the decline in the next sessions.
Summary
The Celestia (TIA) token has delivered a trend reversal and is showcasing retracement in the last sessions. However, the token is on the verge of the trendline and may face a breakdown below $14.80. Amidst the market volatility, the token did not fall much and it’s in the neutral region, which cleared the strength.
Technical Levels
Support Levels: $14.50 and $14
Resistance Levels: $15.80 and $16.70
Disclaimer
The views and opinions stated by the author or any other person named in this article are for informational purposes only and do not constitute financial, investment, or other advice. Investing in or trading crypto or stocks comes with a risk of financial loss.

Amanda Shinoy is one of the few women in the space invested knee-deep in crypto. An advocate for increasing the presence of women in crypto, she is known for her accurate technical analysis and price prediction of cryptocurrencies. Readers are often waiting for her opinion about the next rally. She is a finance expert with an MBA in finance. Quitting a corporate job at a leading financial institution, she now engages herself full-time into financial education for the general public.


