
 Home
Home News
News
- 1 Blur price is trading above the key moving averages, showcasing bullishness on the daily charts.
- 2 The BLUR price faced a mild bearish move in the previous sessions.
BLUR price forecast demonstrates the bullishness in the daily timeframe chart. However, the sellers are trying to overtake the buyers and take control of the price in their grasp.
The BLUR price action showcases bullishness, as Blur crypto keeps the gains on the upper side in the bullish zone and surpasses the rejections. The sellers are still making short positions and trying to cause a downside in the crypto.
BLUR crypto mirrors bullishness and keeps holding the gains above the top. Bulls are accumulating the crypto and getting ready to cross $0.7000 in the next sessions.
The chart formation shows the buying’ momentum and signals an optimistic outlook on the charts. Blur crypto is aiming to achieve a breakout soon, and investors are watching it closely.
The price action indicates a strong chart structure with bulls’ dominance, and long buildup activity was noted in the past trading sessions. Moreover, sellers were now becoming cautious due to the vertical rally that trapped sellers in the past months.
The BLUR price was at $0.6052 and lost 7.00% of its market capitalization during the day’s trading session. The last 24-hour trading volume was 229.07 Million. It indicates that bulls are trying to earn to surge toward the upper trendline.
Technical Analysis of BLUR Crypto Price in 1-D Timeframe
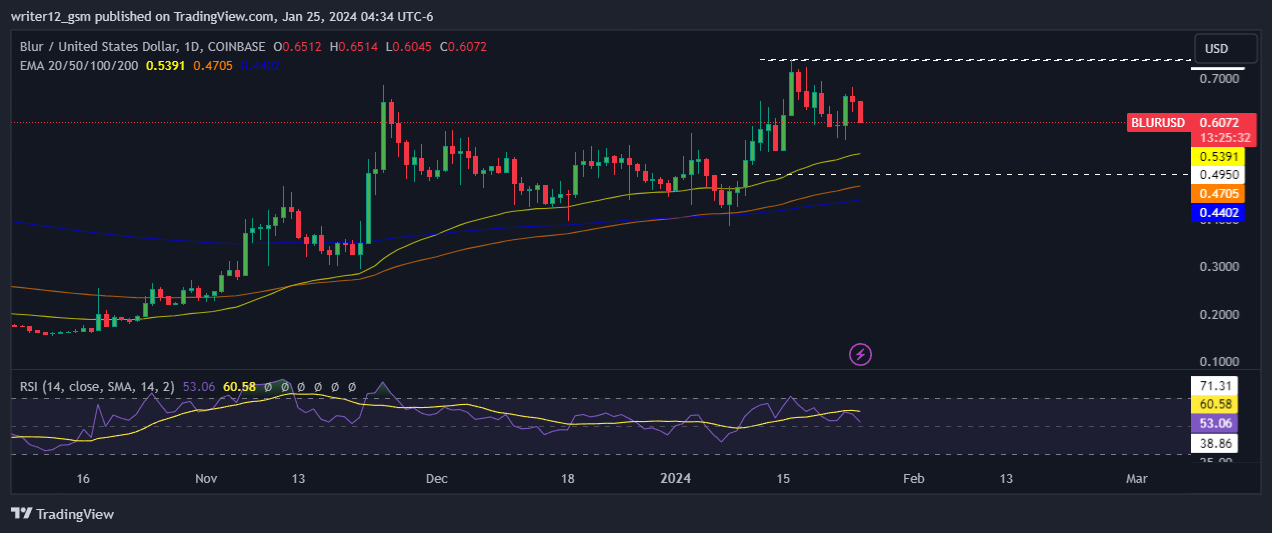
The BLUR price has steadily seen its price rise for the past three months, inclining by 155.87% and 14.21% in the last month. Currently, Blur crypto is trading at a bullish pace and has been trying to hold on to this level after a mild bearishness on the chart.
Currently, BLUR crypto is trading above the 50 and 200-day SMAs (Simple moving averages), which are supporting the price momentum.
The current value of RSI is 53.08 points. The 14 SMA is above the median line at 60.58 points, which indicates that the BLUR crypto is neutral.
The MACD line at 0.0342 and the signal line at 0.0256 are above the zero line. A bearish crossover is observed in the MACD indicator, which signals weakness in the momentum of the Blur crypto price.
Summary
BLUR (USD: Blur) technical indicators support the bullish trend. The MACD, RSI, and EMA are highlighting optimistic signals and indicate that the uptrend may persist in the Blur crypto price. The Price action demonstrates that the investors and traders are bullish on the 1-Day time frame. It reflects a bullish outlook at the present moment.
Technical Levels
Support Level: $0.4950.
Resistance Levels: $0.7388.
Disclaimer
This article is for informational purposes only and does not provide any financial, investment, or other advice. The author or any people mentioned in this article are not responsible for any financial loss that may occur from investing in or trading. Please do your own research before making any financial decisions

Steefan George is a crypto and blockchain enthusiast, with a remarkable grasp on market and technology. Having a graduate degree in computer science and an MBA in BFSI, he is an excellent technology writer at The Coin Republic. He is passionate about getting a billion of the human population onto Web3. His principle is to write like “explaining to a 6-year old”, so that a layman can learn the potential of, and get benefitted from this revolutionary technology.


