
 Home
Home News
News
- 1 Chainlink’s price forecast demonstrates the bearish phase in the price.
- 2 Chainlink’s price broke below the 100-day moving average, showcasing bearishness.
Chainlink price forecast implies a correction phase and Bears looked aggressive in the previous sessions breaking below the 20 and 50-day moving averages.
LINK price is halted near the value of $17 and heading downward toward its dynamic support range. A link has a support level of $11.592 which can prevent it from further downside.
Chainlink (LINK) failed to sustain the high of $17 and reversed its direction, resuming the downtrend that indicates further weakness in the market. The market is trading below the dynamic support trendline, which could lead to more downside. The LINK price is also in a downtrend on a larger timeframe, as it is creating lower lows.
Chainlink has been falling from its peak levels and forming a bearish outlook on the chart. It is in a bearish mood after breaking below the 20-day and 50-day moving average. The bearish pressure could push LINK to form a new lower low soon and extend the downtrend.
The current situation requires LINK traders and investors to be patient and wait for a clear signal of a break above or below the range before making any moves. They should also avoid fear of missing out and minimize losses.
The Chainlink crypto price fell 11.76% last week. It declined by 10.97% throughout the month. Furthermore, the LINK crypto experienced a rise of roughly 78.82% within the past six months and an increase of 108.74% over the past year.
Additionally, the LINK crypto price has slipped by approximately 6.92% year to date. These trends collectively indicate the price is volatile throughout the year.
Technical Analysis of the Chainlink Crypto Price in 1-D Timeframe
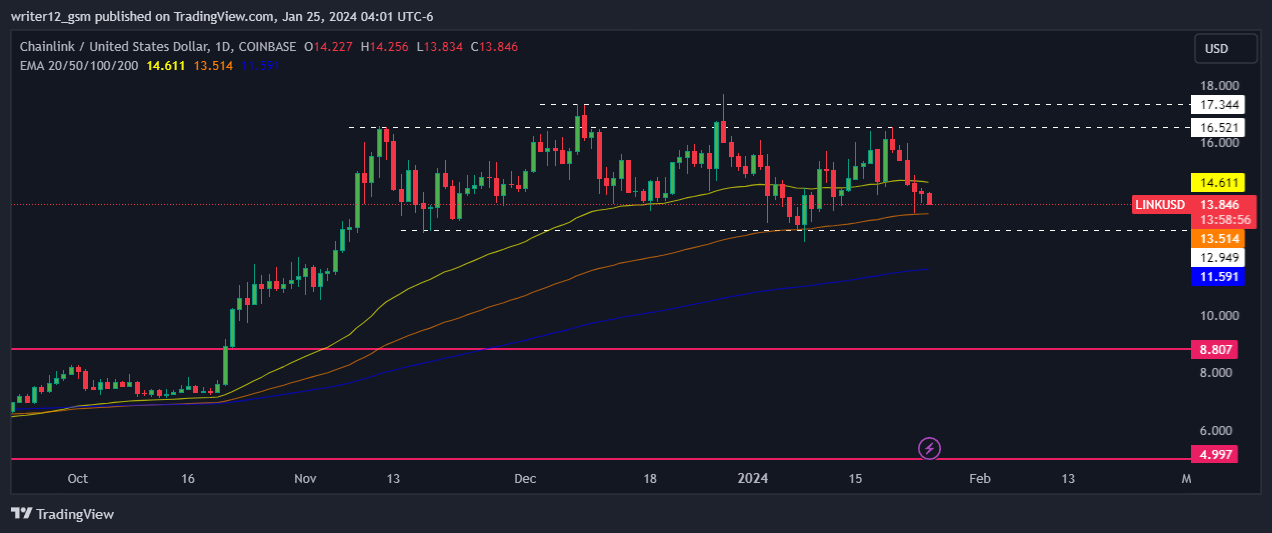
At the moment, Chainlink crypto (USD: LINK) is trading below the 50 and 20-day EMAs (exponential moving averages), which are not supporting the price trend. If bulls want to make a comeback, they will have to rise and sustain the price above the 20 and 50-day EMA. However, the sellers seem to be more aggressive as compared to buyers.
The current value of RSI is 43.15 points. The 14 SMA is above the median line at 50.49 points, which indicates that the Chainlink crypto is bearish.
The MACD line at -0.087 and the signal line at 0.024 are above the zero line. A death crossover is observed in the MACD indicator, which signals more bearishness for the LINK crypto price.
Summary
Chainlink crypto price prediction suggests a mild bearishness in the chart. The sellers are overlooking higher levels. Chainlink (USD: LINK) technical oscillators also support the bearish trend. The MACD, RSI, and EMA highlight pessimistic signs and imply that the downtrend may resume in the LINK crypto price.
Chainlink Price action indicates that the investors and traders are bearish on the 1-D time frame. The technical analysis suggests that the Chainlink crypto price is in a bearish grip and the probability of testing the previous highs in the coming months remains high as the price might bounce back from the 200 EMA level.
Technical Levels
Support Levels: $12.949.
Resistance Levels: $17.344.
Disclaimer
This article is for informational purposes only and does not provide any financial, investment, or other advice. The author or any people mentioned in this article are not responsible for any financial loss that may occur from investing in or trading. Please do your own research before making any financial decisions

With a background in journalism, Ritika Sharma has worked with many reputed media firms focusing on general news such as politics and crime. She joined The Coin Republic as a reporter for crypto, and found a great passion for cryptocurrency, Web3, NFTs and other digital assets. She spends a lot of time researching and delving deeper into these concepts around the clock, and is a strong advocate for women in STEM.


