
 Home
Home News
News
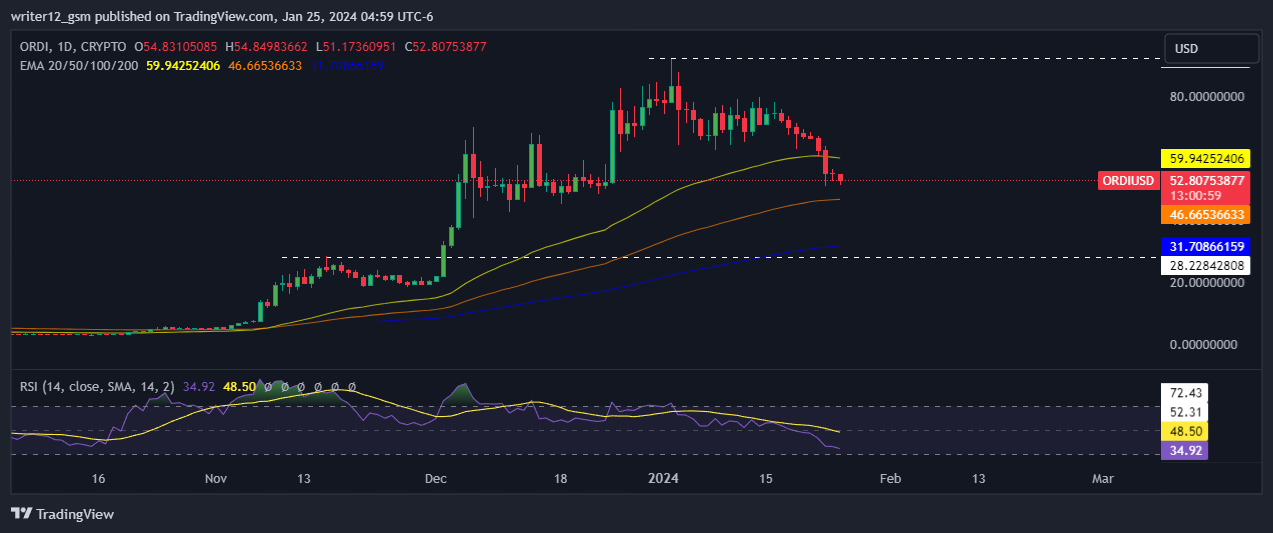
- 1 ORDI Price breaks below the key moving averages, showcasing the daily chart’s bearishness.
- 2 ORDI Price is showing the trend control is shifting from the bull’s grip.
The ORDI Price is trading in a bearish grasp, heading downward on both the daily and weekly charts. The price already broke important key moving averages and is heading toward the lower supports.
ORDI crypto price has been struggling to break above the $60 resistance level and has been breaking below it. Currently, ORDI crypto’s price needs more bulls to support an upward movement toward recovery. Furthermore, the trading volume is low, which indicates a lack of buying momentum. At the same time, ORDI cryptos have broken below the 20-day and 50-day daily moving averages, which are bearish signals.
The ORDI crypto price lost 27.29% last week. It fell by 30.35% in the month. However, ORDI cryptos witnessed an outstanding incline of about 711.71% in the past six months and a plunge of 33.11% year to date. These trends collectively demonstrate the recent weakness in the price.
The price at present demands noteworthy support from the bulls to make a comeback as it is facing major resistance from the previous resistance points and numerous moving average levels. Buyers are removing the price action into their hold, as per to the price action.
The price may soon attempt to make a bullish recovery. Nevertheless, as it is trading below the critical EMA levels, the bulls will have to encounter considerable resistance levels to achieve the target. Bulls are presently taking ongoing measures to retake control of the trend.
Will the ORDI Price Break Below the $50 Mark?
Technical indicators suggest the downside trend of ORDI crypto price. Relative strength index and moving average convergence divergence both indicate the slippage of ORDI crypto price.
ORDI crypto has shown sellers’ strength, and profit booking in the crypto was noted on the daily-term charts. Moreover, the price traded under the key EMAs displays further weakness in the crypto.
The RSI curve is near the oversold region at 34 and a negative outlook was noted, indicating bearishness in the crypto. The MACD indicator also continued to create red bars and a bearish crossover was recorded, which indicates corrective moves.
Overall, the technical indicators and price action suggest that ORDI crypto is bearish and that the downtrend may continue.
Weekly-Time Horizon Analysis of Ordi Price
Ordi crypto has demonstrated sellers’ strength on the weekly charts. The RSI curve is near the overbought region and a negative viewpoint was noted, indicating bearishness in the crypto. The MACD indicator also persisted to form red bars and a bearish crossover was noted, which signals bearish moves.
Summary
ORDI (USD: ORDI) technical indicators indicate a bearish trend. The MACD, RSI, and EMA are highlighting the negative signals and imply that the downside trend may resume in the ORDI crypto price. The ORDI Price action indicates that the investors and traders are negative on the daily time frame. It speculates a bearish outlook at the moment.
Technical Levels
Support: $46.666.
Resistance: $59.945.
Disclaimer
This article is for informational purposes only and does not provide any financial, investment, or other advice. The author or any people mentioned in this article are not responsible for any financial loss that may occur from investing in or trading. Please do your own research before making any financial decisions.
Steve Anderson is an Australian crypto enthusiast. He is a specialist in management and trading for over 5 years. Steve has worked as a crypto trader, he loves learning about decentralisation, understanding the true potential of the blockchain.


