
 Home
Home News
News

- 1 The AAVE token experienced a downfall and has retested the 200-day EMA in the last sessions.
- 2 The token is hovering below the round mark of $100 and is delivering bearishness.
The AAVE token replicates bearishness and is hovering below its support region of $100, delivering a selloff in the last sessions. The token has breached its critical level of $100 and is signaling bears’ dominance on the charts. Moreover, the price action signals a down move below the 200-day EMA, which is the prompt support zone near $85. Amidst the market volatility, the token has reverted from the top of $120 and noted profit booking in the past weeks.

The AAVE token price has slipped below the 20, 50, and 100-day EMAs, which signifies bearishness on the charts. However, the 200-day EMA is the make-or-break region for the bulls, whereas the lower-low formation is still depicted. Additionally, the follow on selling pressure reveals the bears’ intention of breaching the demand zone of $85 in the coming sessions.

The price of the cryptocurrency was $93.10 at press time with an intraday gain of 0.75%, showing bearishness. Moreover, the trading volume increased by 14.10% to $85.83 Million, highlighting the selling pressure. The pair of AAVE/BTC was noted at 0.00215 BTC, while the market cap is $1.39 Billion. Analysts are neutral and suggest that the token will face a breakdown in the upcoming sessions.
The AAVE Price on Daily Charts Displays Rounding Top Formation
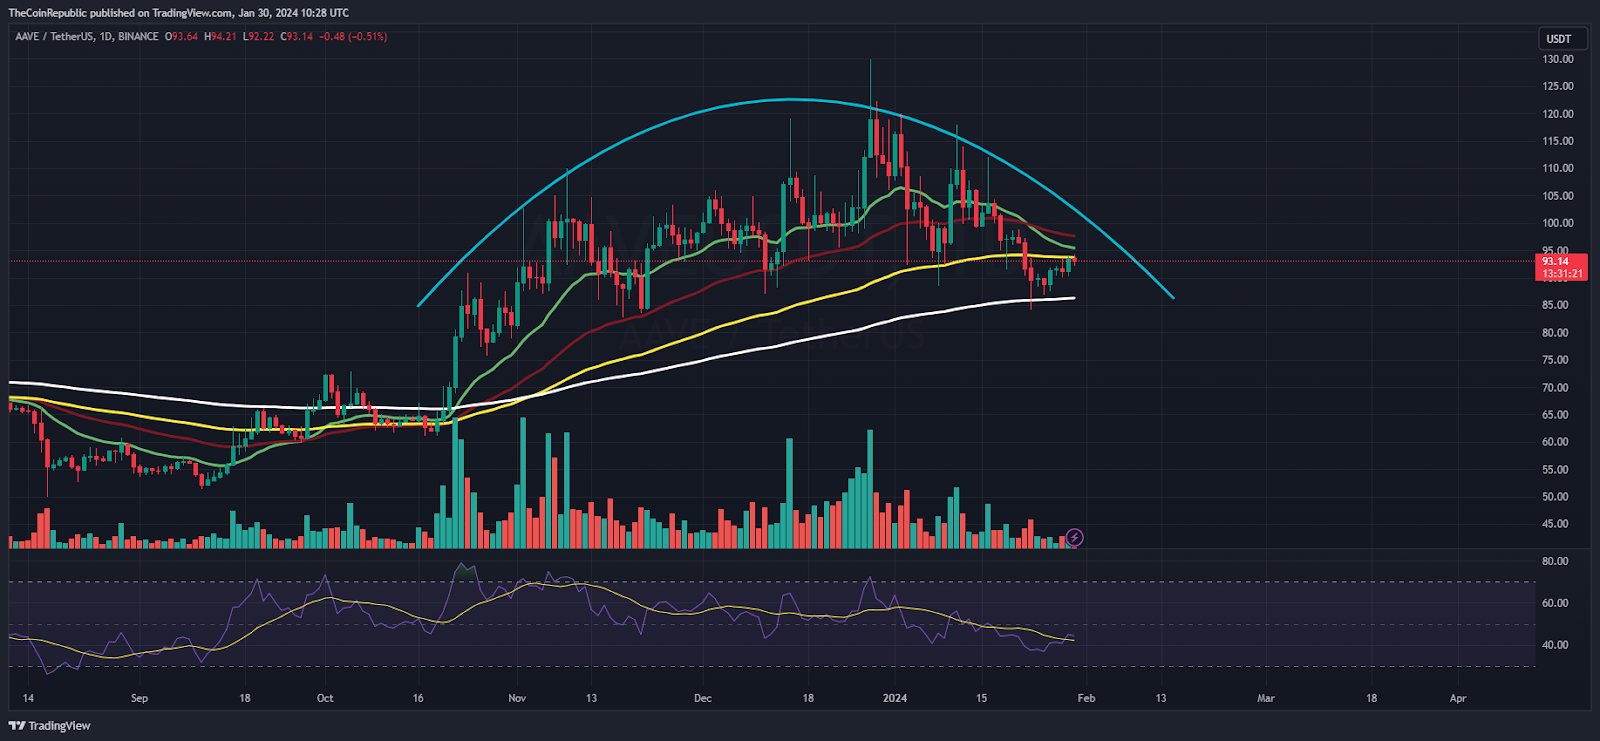
On the daily charts, the AAVE price slipped below the round mark of $100 and eroded over 25% of gains in the recent sessions. Additionally, a rounding top formation was witnessed, which signals bear strength. Furthermore, the bear cartel is attempting another selloff to push the token below the 200-day EMA mark. If the token breaches that mark, it may fall to $70 in the upcoming weeks. Conversely, if a rebound happens, it may retest the $100 level soon.
The RSI curve slipped below the midline and delivered a neutral outlook amidst the selloff. The MACD indicator shows a bearish crossover and signals a downfall in the upcoming sessions.
AAVE on Weekly Charts Reflects Rejection from the 100-Day EMA
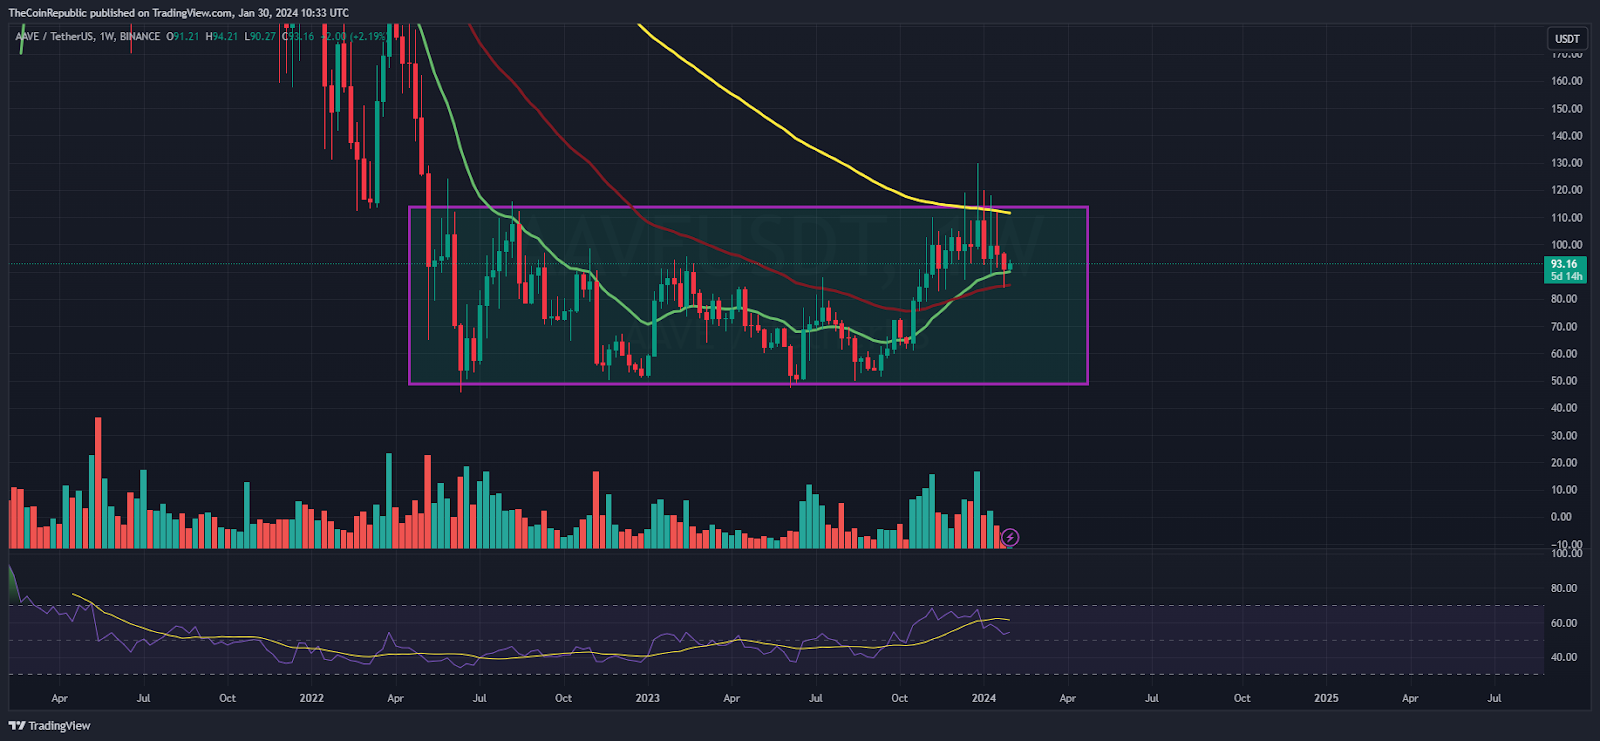
On the weekly charts, the AAVE price has retested the range top neckline near the 100-day EMA mark but failed to cross and meet a reversal. However, the reversal was not too intense. A consolidation was noted near the no-trade zone of $90. Per the Fib levels, the AAVE token price trades below the 38.2% zone and is heading to the 23.6% zone.
Summary
The AAVE price slipped below its support region of $100 and is experiencing a selloff in the recent sessions. The trend favors the downfall. The bulls are attempting to sustain the gains and secure the 200-day EMA to avoid a rash selloff.
Technical Levels
Support Levels: $85 and $80
Resistance Levels: $100 and $110
Disclaimer
The views and opinions stated by the author or any other person named in this article are for informational purposes only and do not constitute financial, investment, or other advice. Investing in or trading crypto or stocks comes with a risk of financial loss.

Amanda Shinoy is one of the few women in the space invested knee-deep in crypto. An advocate for increasing the presence of women in crypto, she is known for her accurate technical analysis and price prediction of cryptocurrencies. Readers are often waiting for her opinion about the next rally. She is a finance expert with an MBA in finance. Quitting a corporate job at a leading financial institution, she now engages herself full-time into financial education for the general public.


