
 Home
Home News
News
- 1 The Fetch.ai displayed good performance last quarter.
- 2 The FET price surged and strongly approached major EMAs from below, indicating bullish strength.
The Fetch.ai crypto is experiencing a decline of 1.11% in the last 24 hours, trading at $0.6213. The crypto was in a good uptrend in the last three months and it surged from $0.2000 to 0.8000 at a good pace.
But the FET crypto price was in a quick uptrend and the supply was strong, the price ended up consolidating at the top showing buyers weakness and the price dipped some points and reached $0.5246.
Can FET Crypto Price Reach $1 Next?
However, the FET crypto has exhibited a sign of resurgence as the price rebounded from a pivotal level of around $0.5246 on the chart.
The FET crypto is on the verge of a stunning breakout, as it gathers momentum to shatter the ceiling and fly higher and higher from the current pivotal support level.
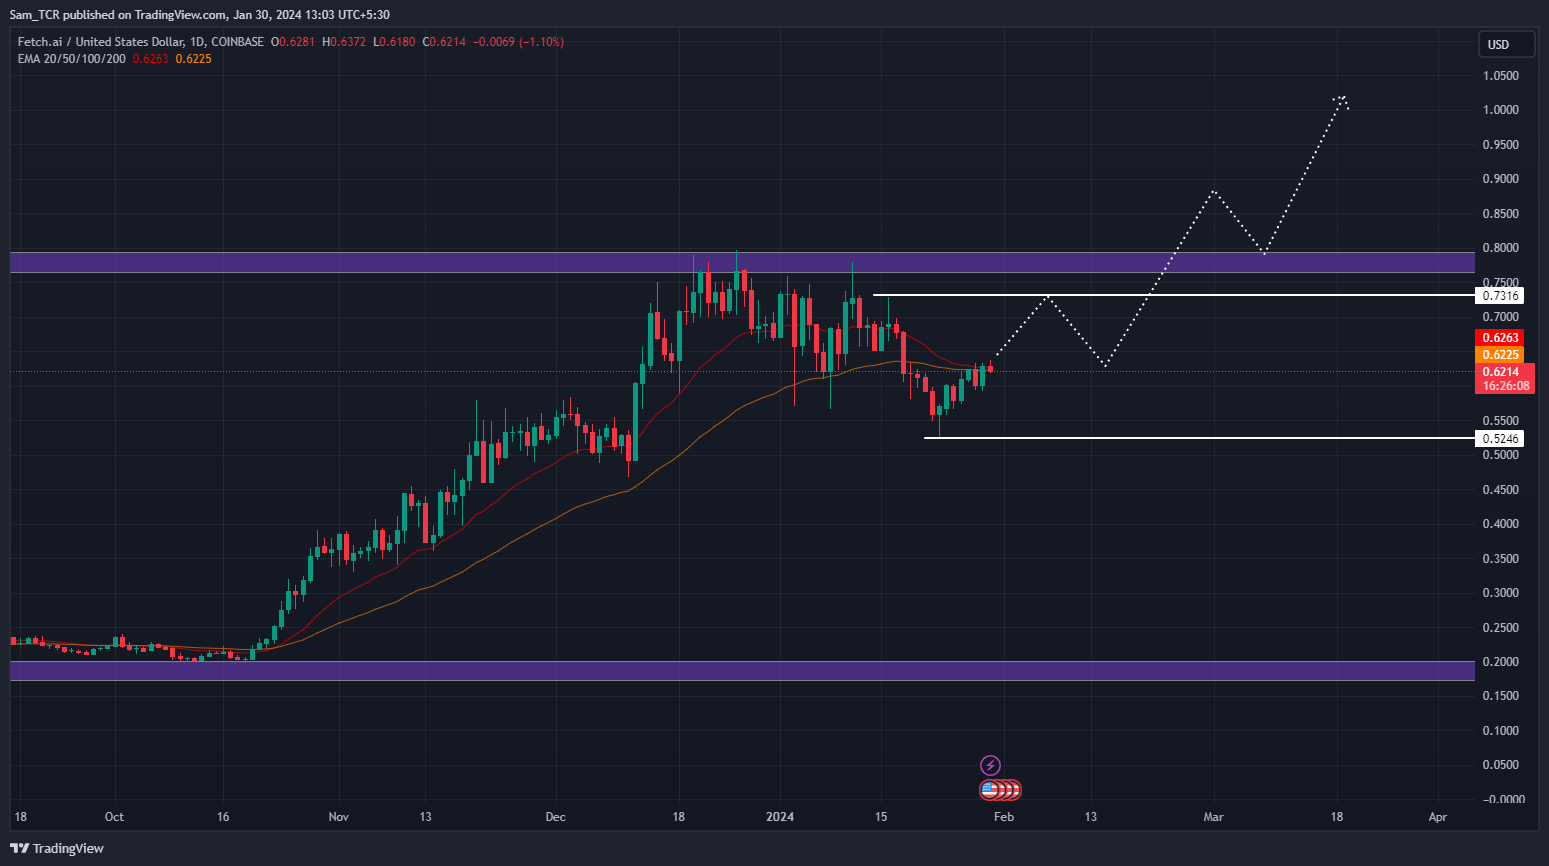
Therefore, if the demand for the FET crypto advances, the price could bounce back from the aid of the current pivotal level. Then, the next aim for the price could be to reach $1, and the primary resistance to $0.8000.
The overall analysis of Fetch.ai crypto asset has exhibited bullish features and shows that price structure can reach higher levels. Furthermore, it displayed good performance in the previous week, and quarter by +10.71% and +70.38% respectively, signifying a strong upward force.
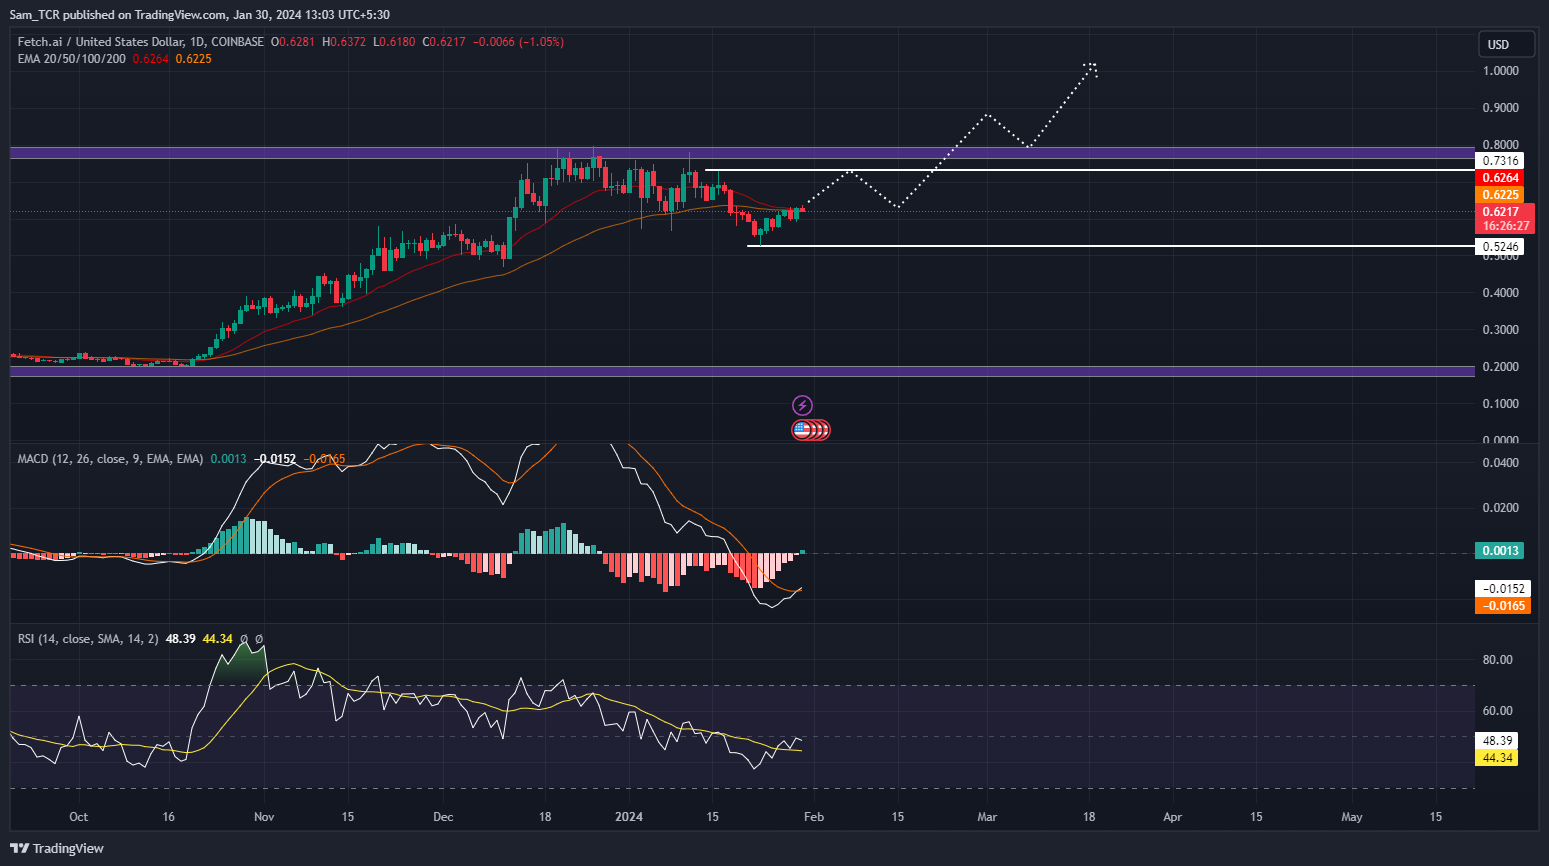
The FET crypto asset was rising steadily until it hit the supply region, it dropped some points and slipped beneath the dynamic supports of 20, and 50-Day EMA. With the recent turnaround from the pivotal level of $0.5246, the FET price surged and strongly approached major EMA’s from below, indicating bullish strength.
Furthermore, the FET crypto asset is showing bullish momentum as MACD has shown a bullish cross over and the histogram has converged fully and is ready to diverge. Besides, the MACD is at -0.0152 with the signal line at -0.0165, and the gap between them known by histogram is at 0.0013.
The RSI is rising steadily on the FET crypto chart with the curve taking support at the 14-SMA smoothened line, indicating that the asset is not losing steam, but instead is gaining steam and could continue to climb.
On the flip side, if FET crypto price fails to stay above $0.5246, it could decline further and reach the depths of the chart.
Summary
The FET crypto price has recovered from a low of $0.5246 and is aiming for $1. The technical indicators show bullish signs and strong performance. However, if the price falls below the support level, it could drop further.
Technical Levels
Support Levels: $0.5246
Resistance Levels: $0.8000
Disclaimer
In this article, the views, and opinions stated by the author, or any people named are for informational purposes only, and they don’t establish the investment, financial, or any other advice. Trading or investing in cryptocurrency assets comes with a risk of financial loss.

With a background in journalism, Ritika Sharma has worked with many reputed media firms focusing on general news such as politics and crime. She joined The Coin Republic as a reporter for crypto, and found a great passion for cryptocurrency, Web3, NFTs and other digital assets. She spends a lot of time researching and delving deeper into these concepts around the clock, and is a strong advocate for women in STEM.


