
 Home
Home News
News
- 1 The BTG crypto chart, with an angle of indicators, the BTG crypto asset is showing bullish strength and rising potential.
- 2 The BTG crypto has displayed a sign of revival as the price bounced back from a critical level.
The Bitcoin Gold crypto asset is showing bullish traits and can achieve more growth in the upcoming future sessions. Furthermore, on the BTG chart, it has demonstrated good performance in the past week, month, and three months, by 11.02%, 4.53%, and 54.07% respectively, indicating a reliable upward trend.
At press time, the BTG crypto is experiencing a decline of 2.15% in the last 24 hours, trading at $22.880, and the 24-hour trading volume is 7.58 Million. The price action is in uptrend which is making higher highs and lows in the process. The recent setback came in price from the supply region at $29 and dipped to $20, this showed a healthy correction in the BTG.

However, the BTG crypto has displayed a sign of revival as the price bounced back from a critical level of around $20 on the day time frame chart.
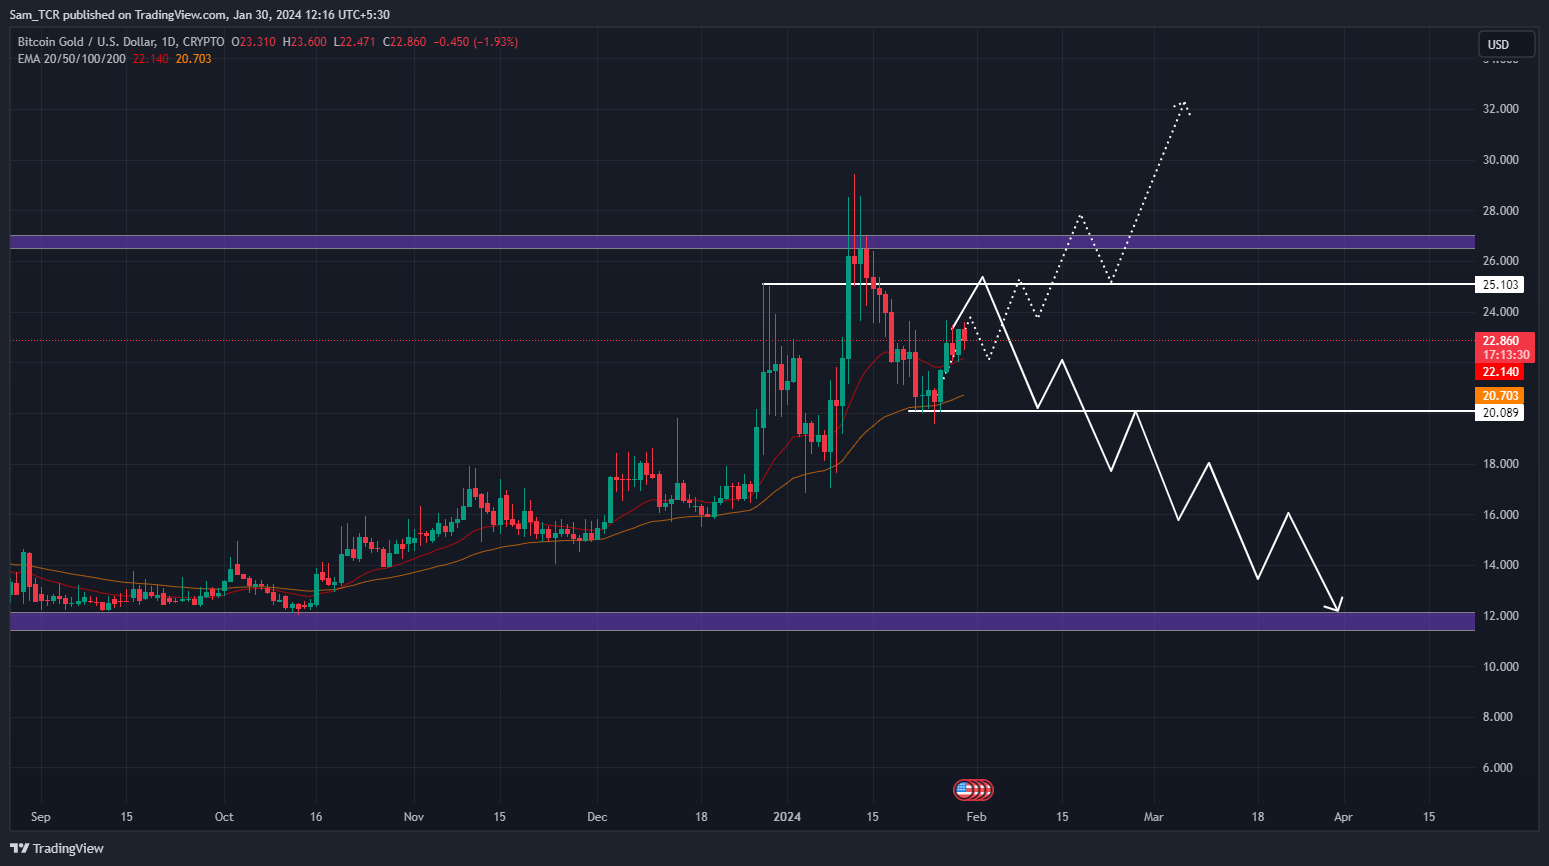
Now, there are two strong possibilities from the current price level.
Eitherways, the BTG crypto could demonstrate a sensational surge and unleash its potential to topple the resistance level and soar to new zeniths from the critical support of $20.
Or, the BTG crypto could show a dismal plunge if it fails to break the resistance level of $25 and could sink below the critical support. With this level breached, it could hit a major demand zone.
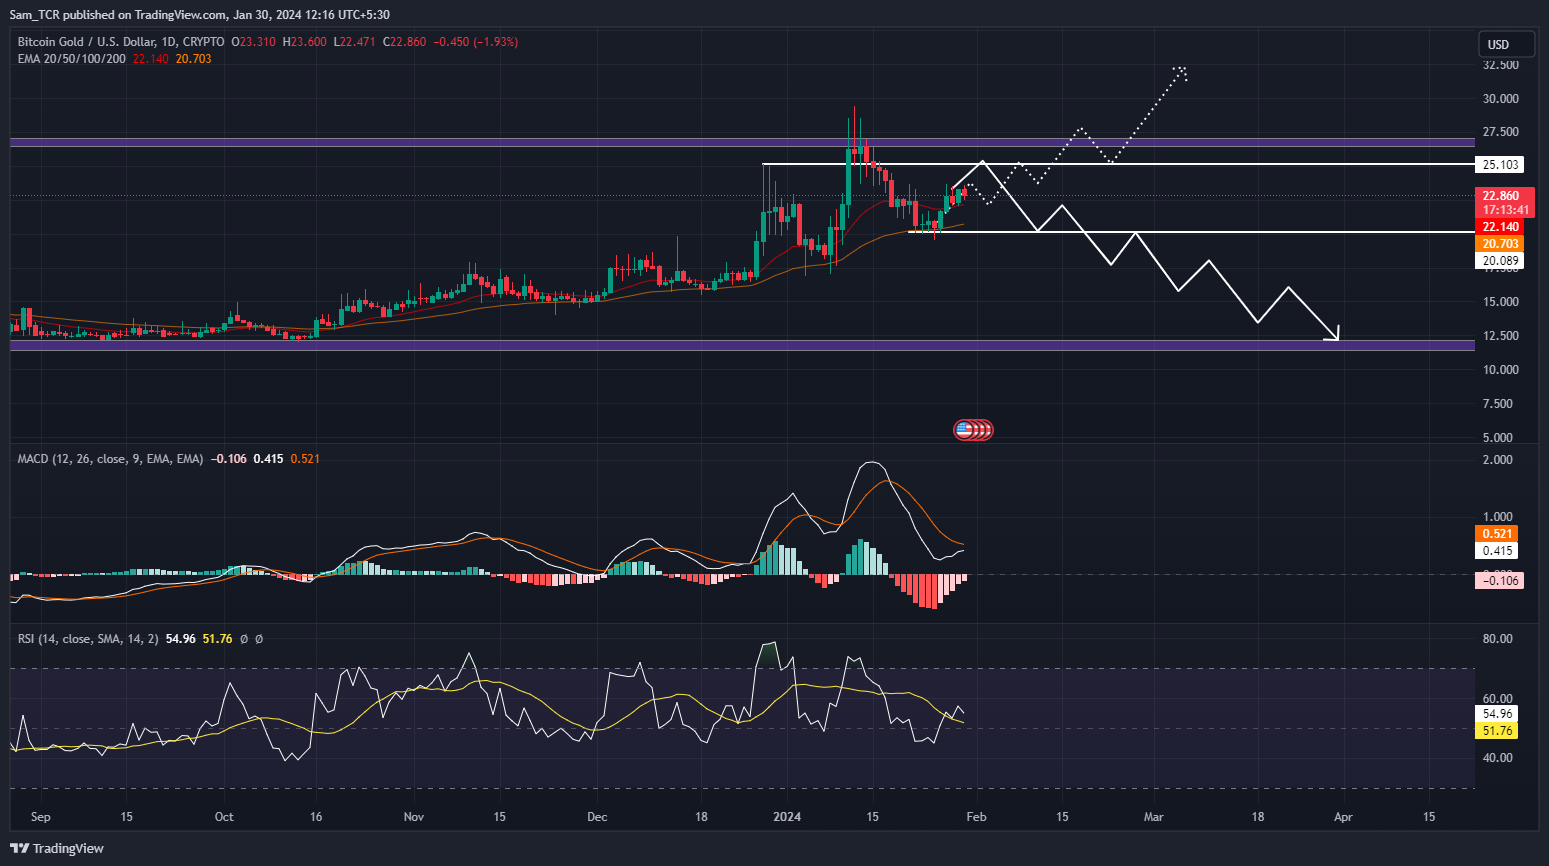
On looking at the BTG crypto chart, with an angle of indicators, the BTG crypto asset is showing bullish strength and rising potential as it stays above major 20 and 50-Day EMAs.
Furthermore, the Bitcoin Gold crypto asset shows the histogram is converging and a bullish cross is anticipated next in the upcoming sessions. Besides, the details show that the histogram graph value is -0.107, the MACD value is at 0.414, and the signal line is at 0.521, which is above the zero line.
The RSI shows no signs of overbought conditions yet. The RSI curve has taken support from the 14-SMA smoothened line and is headed upwards, signifying bullishness and suggesting that BTG crypto price has more room to grow. Meanwhile, both curves are above the median line, which highlights that the price is in bullish territory and 14-SMA is at 51.74 with the RSI curve at 54.66.
Therefore, if the demand for BTG escalates heavily by the buyers, the asset price could show a remarkable bounce back from the current level. Then the next goal for the price could be to reach $25.
However, if the BTG crypto price fails to stay above the $20 level, it could decline further.
Summary
The BTG crypto price can go either way from the current price. It can rise sharply and break the $25 resistance, reaching new highs from the $20 support. On the other hand, it could fall steeply and lose the $20 support, dropping to the major demand zone.
Technical Levels
Support Levels: $20
Resistance Levels: $25
Disclaimer
In this article, the views, and opinions stated by the author, or any people named are for informational purposes only, and they don’t establish the investment, financial, or any other advice. Trading or investing in cryptocurrency assets comes with a risk of financial loss.

Nancy J. Allen is a crypto enthusiast, with a major in macroeconomics and minor in business statistics. She believes that cryptocurrencies inspire people to be their own banks, and step aside from traditional monetary exchange systems. She is also intrigued by blockchain technology and its functioning. She frequently researches, and posts content on the top altcoins, their theoretical working principles and technical price predictions.


