
 Home
Home News
News

- 1 RUSH coin price showed a retracement and is switching back to its demand zone.
- 2 Buyers are attempting a pullback and hovering below the 20-day EMA mark.
The RUSH coin price slips below the neutral region and is heading to the bearish trajectory, revealing a selloff in the recent sessions. Moreover, the price action signifies the follow-on selling momentum. The coin finds it challenging to hold out the gains and slips below the key moving averages. Furthermore, the weak trend favors bears, suggesting a downside toward $0.0001200 in the following sessions.
The RUSH coin price hovers close to the demand zone and shows a bearish outlook, indicating bear dominance. Furthermore, the price action showcased the lower low swings, demonstrating a correction in the recent sessions. Additionally, the coin forms a descending triangle formation close to the lower neckline of $0.0001200. If it breaks, the price will crack below $0.0001150 and may go to $0.0001100 in the following sessions.

The cryptocurrency price was $0.0001254 at press time with an intraday drop of 4.81%, showing bearishness. Moreover, the trading volume increased by 12.10% to $4114, highlighting the low interest of investors. The pair of RUSH/BTC was noted at 0.00000000299 BTC and the market cap is $377,400. Analysts are neutral and suggest that the RUSH price will persist in hovering near the demand zone.
The RUSH Coin Price on Daily Charts Forms Falling Wedge Pattern

On the daily charts, the RUSH price slipped to the make-or-break region and is hovering near the neckline of $0.0001200, which signifies selling pressure in the recent sessions. The price action recites the bearish scenario and reflects the mighty bears’ strength on the charts. Additionally, the bears are trying to crack the demand zone. They are defeating the bulls in the last sessions.
The RSI curve slipped to the oversold region and showed a negative crossover, revealing underperformance on the charts. Moreover, the MACD indicator shows a bearish crossover and the red bars on the histogram suggest that the coin price might face volatility in the upcoming sessions.
The RUSH Coin Price on Weekly Charts Displays Rejection From Range Top
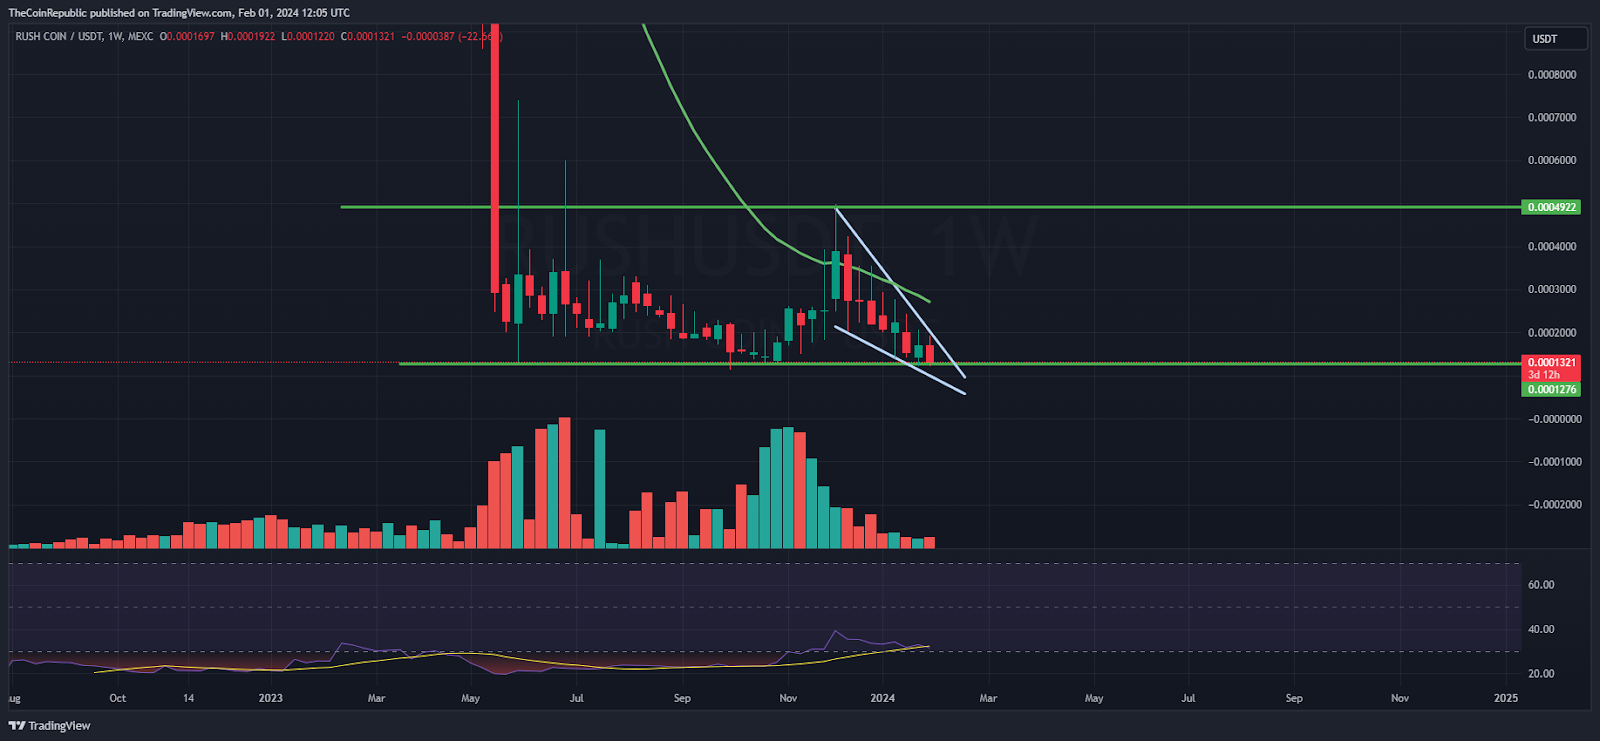
Over the past weeks, the RUSH coin was in a narrow range and a rejection from the range top was noted in the last sessions. It eroded the gains by over 70%. Additionally, the sellers have gained traction and are attempting to breach the range lows of $0.0001200 to make a fresh low ahead.
Summary
The RUSH price is hovering near the demand zone of $0.0001200, reflecting selling pressure in the recent sessions. The trend favors the bears and suggests a volatile outlook for the upcoming sessions. This coin may attain a pullback based on the oversold status or continue to drag gains.
Technical Levels
Support Levels: $0.0001200 and $0.0001160
Resistance Levels: $0.0001300 and $0.0001360
Disclaimer
The views and opinions stated by the author or any other person named in this article are for informational purposes only and do not constitute financial, investment, or other advice. Investing in or trading crypto or stocks comes with a risk of financial loss.

Andrew is a blockchain developer who developed his interest in cryptocurrencies while pursuing his post-graduation major in blockchain development. He is a keen observer of details and shares his passion for writing, along with coding. His backend knowledge about blockchain helps him give a unique perspective to his writing skills, and a reliable craft at explaining the concepts such as blockchain programming, languages and token minting. He also frequently shares technical details and performance indicators of ICOs and IDOs.


