
 Home
Home News
News

- 1 Luna Price forecast demonstrates a bearish trend on the daily time frame.
- 2 The Terra price is trading below the key moving averages dominating.
The technical chart of the Terra crypto showed that extreme selling pressure was noted on the daily charts and was in a downtrend, forming lower lows over the past few months. Furthermore, trading volume could have been higher due to declining investor interest.
Moreover, the Terra price showed a decline in user activity, which also reacted as a pessimistic sentiment for the crypto and led to bearishness in the technical charts.
When writing, the Terra price is trading at $0.00009656 with an intraday loss of 0.23%, showing bearishness on the daily technical chart. Moreover, the intraday trading volume is $18.11 Million and the market cap is $363.73 Million.

Crypto has had a volatile performance throughout the years. Since the beginning, it gave unfavorable returns of 29.98% and gained by 24.16% in 6 months. In the last 1 month, it gave a negative return of 30.59% and grew by 4.14% in the last seven days. That Indicates a long volatile trend continuing till now.
The current trend favors sellers and the crypto was also in a corrective phase, which made buyers cautious. Moreover, Terra trades below the significant moving averages and tries to attain the 50-day EMA to shift the trend.
Technical Evaluation of Terra Crypto Price in 1-D Timeframe
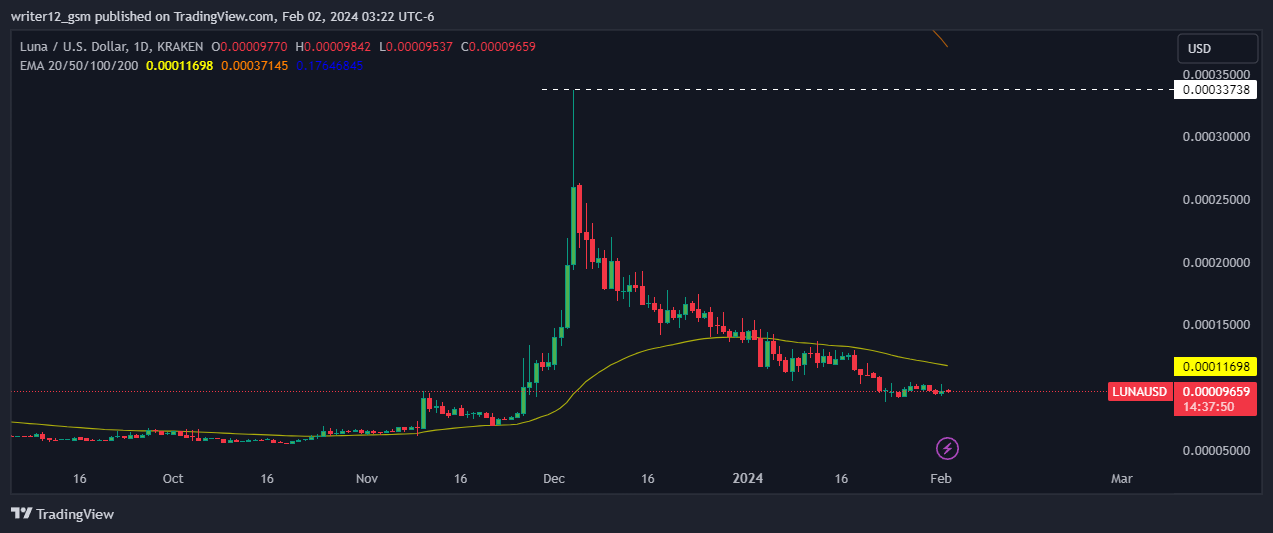
At the time of publishing, the Terra crypto (USD: Luna) is trading below the 50 and 200-day EMAs (exponential moving averages), which do not support the price trend. The current value of RSI is 37.68 points. The 14 SMA is above the median line at 36.00 points, which indicates that the Terra crypto is bearish.
The MACD line at -0.00000876 and the signal line at -0.00000943 are above the zero line. A bearish crossover is observed in the MACD indicator, which signals more bearishness for the Luna crypto price.
As per the technical summary, the LUNA crypto is indicating a sell signal as out of 26 analysts, 13 are on the sell side, 10 are on the neutral side, and 3 are on the buying side. However, the maximum weightage is on the sell side. The technical summary indicates that sellers are overpowering the trend and most of the analysts are on the bear’s side and supporting the negative perspective.
Summary
Terra (USD: Luna) technical indicators reinforce the negative trend. The MACD, RSI, and EMAs are emphasizing bearish signs and imply that the downtrend may resume in the Luna crypto price. The Terra price action suggests that the investors and traders are bearish on the 1-D time frame. The price action mirrors a negative perspective at the moment.
Technical Levels
Support Levels: $0.00011698.
Resistance Levels: $0.00009000.
Disclaimer
This article is for informational purposes only and does not provide any financial, investment, or other advice. The author or any people mentioned in this article are not responsible for any financial loss that may occur from investing in or trading. Please do your own research before making any financial decisions
Anurag is working as a fundamental writer for The Coin Republic since 2021. He likes to exercise his curious muscles and research deep into a topic. Though he covers various aspects of the crypto industry, he is quite passionate about the Web3, NFTs, Gaming, and Metaverse, and envisions them as the future of the (digital) economy. A reader & writer at heart, he calls himself an “average guitar player” and a fun footballer.


