
 Home
Home News
News

- 1 The MARA stock displayed a sharp correction from the top of $30 recently.
- 2 Buyers have trapped and are unwinding their long positions.
The MARA (NASDAQ: MARA) stock remarked a turnaround from the highs and has met selling pressure for the past sessions. Moreover, the stock has rotted the gains and re-entered the bearish region below $20. The price action tells range-bound moves post-selloff from the highs, and buyers are now holding the gains and are trying to recover.

Marathon Digital Holdings (MARA) stock has retested the supply zone of $30 after a massive recovery from the lows of $14. Afterward, the bear army led an intense push and tossed back the stock from the highs, resulting in an erosion of over 40% in the last sessions. However, the stock is near the hurdle of $20, which, if surpassed, bulls will retain potency and may acquire stability in the following sessions.

At press time, MARA stock price was noted at $18.20 till the Friday session closing with an intraday drop of 2.15%, showing rejection from the resistance of $20. Moreover, the stock faces consolidation and forms doji candles depicting sellers’ dominance. Analysts are neutral and gave a hold rating with a yearly target price of $19.75, which was hit recently.
MARA on Daily Charts Displays Rejection From Highs
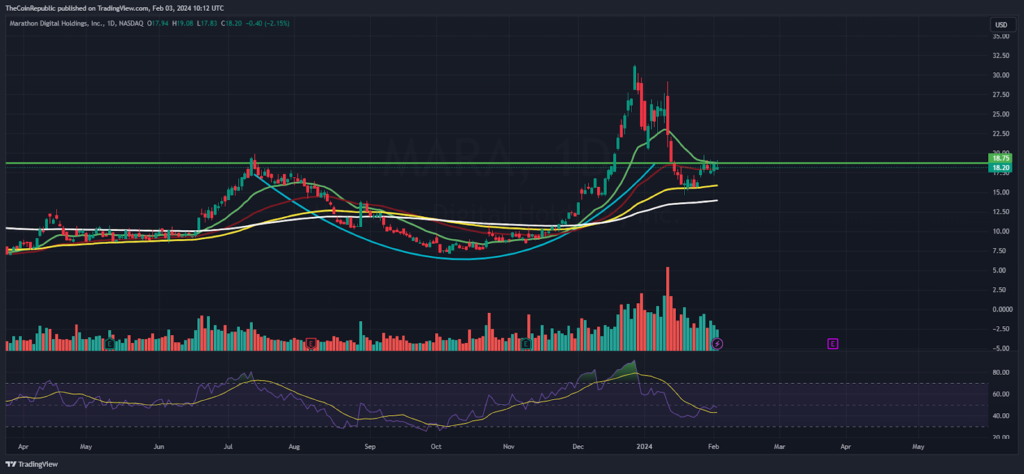
On the daily charts, the MARA stock recorded a rounding bottom formation and a breakout above the neckline hurdle of $18 in the last sessions. Afterward, the stock rallied and retested the previous year’s highs of $30. Amidst the uptrend, the stock encountered sharp rejection and departed toward the breakout region besides.
The RSI curve sharply fell from the overbought zone to the midline near 50, depicting a negative divergence and indicating selling pressure in the last sessions. Moreover, the MACD indicator shows a bearish crossover and replicates bear dominance. As per the option chain data, strong call writing was noted with an open interest of 6564 hundred shares at the strike price of $120, replicating short buildup activity.
MARA on Weekly Charts Reveals Positive Outlook
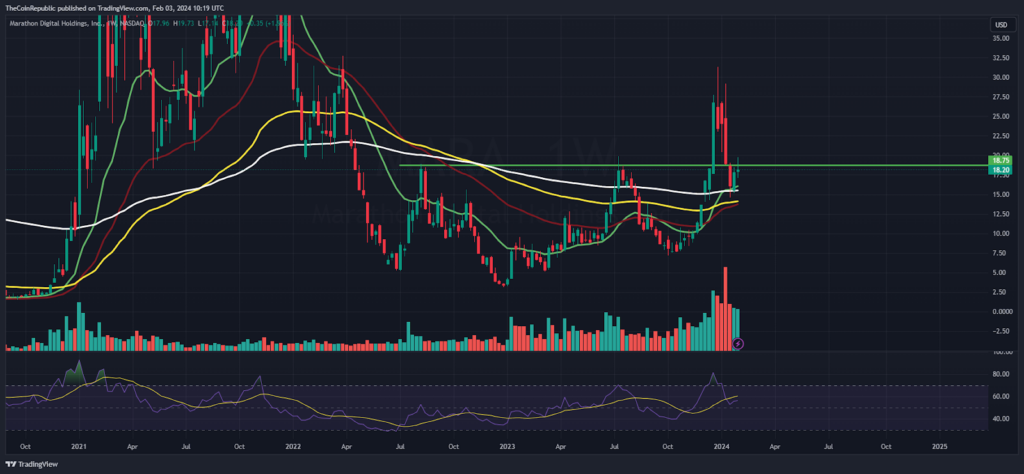
MARA stock has retested its key moving averages on the weekly charts and is exposing neutrality. Furthermore, the price action signifies the retracement of the 38.2% Fib zone. The stock still has enough potential to retain the gains and may reclaim $30 soon.
Summary
The Marathon Digital Holdings‘ (MARA) stock price was rejected from the supply zone, and distribution was implied in the last sessions. Moreover, the stock encountered consolidation and indecisiveness between the bulls and bears. If the stock thrives in escaping $20, it will take a sharp momentum and regain strength. On the other hand, it may continue to slide toward $15 in the coming weeks if it slips below $17.
Technical Levels
Support Levels: $17 and $15
Resistance Levels: $20 and $22
Disclaimer
The views and opinions stated by the author or any other person named in this article are for informational purposes only and do not constitute financial, investment, or other advice. Investing in or trading crypto or stocks comes with a risk of financial loss.

Andrew is a blockchain developer who developed his interest in cryptocurrencies while pursuing his post-graduation major in blockchain development. He is a keen observer of details and shares his passion for writing, along with coding. His backend knowledge about blockchain helps him give a unique perspective to his writing skills, and a reliable craft at explaining the concepts such as blockchain programming, languages and token minting. He also frequently shares technical details and performance indicators of ICOs and IDOs.


