
 Home
Home News
News

- 1 RIOT stock price slips below the 200-Day EMA mark and is showing volatility.
- 2 Buyers are striving for a pullback and strong a rebound.
RIOT (NASDAQ: RIOT) stock price showcased a massive volatile outlook and depicted a roller coaster move amidst the neutral market sentiments. Moreover, the stock replicated an intense reversal from the supply zone of $18 and dragged over 40% in the recent sessions. However, the stock has retested the lower neckline at $10 inside the symmetrical triangle pattern and is attempting a reversal.
Riot Platforms (RIOT) price slips below the key moving averages and has delivered a selloff in the past sessions. The mighty bears look aggressive and have added short positions, signifying bearishness. However, the stock succeeded in holding the demand zone of $10 and noted a rebound. If stock surpasses the prompt hurdle of $12, it may shine toward $15, whereas if it slips below $10.50, it will lead to a drastic correction.

At Friday’s close, RIOT stock price was at $11.21 with an intraday drop of 0.21%, showing bearishness on the charts. Moreover, the price action delivers lower lows and conveys bear dominance. Analysts are bearish and maintain a hold rating with a yearly target price of $19.50. The stock has a monthly return ratio of -19.87%, whereas +55.26% yearly delivers a volatile outlook.
RIOT Stock On Daily Charts Displays Roller Coaster Moves

On the daily charts, the RIOT Platforms (RIOT) price implied a sharp reversal from the supply zone of $18 and lost the initial gains in the last sessions. Furthermore, the price action signifies follow-on selling momentum and short buildup activity. Per the option chain data, open interest increased to 2872 hundred shares at a strike price of $12, which implies robust call writing was done, which acted as a prompt hurdle, whereas $10 is the strong support zone.
The Relative Strength Index (RSI) curve stays in the oversold region, signifying selling pressure in the last sessions. Moreover, the MACD indicator reveals a bearish crossover, suggesting a volatile outlook.
RIOT On Weekly Chart Reveals Selling Pressure From Top
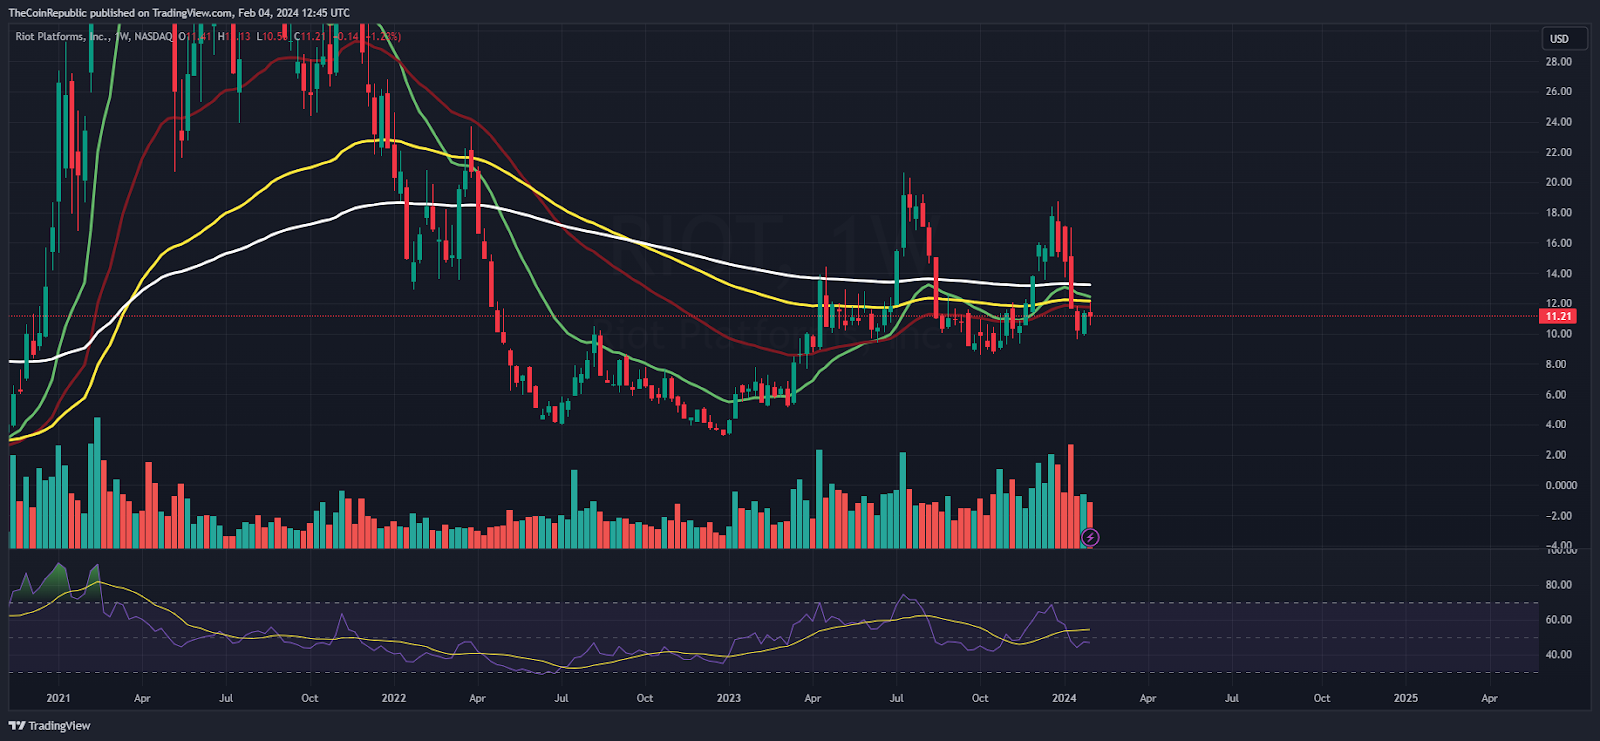
On the weekly chart, the RIOT stock price showcased a rejection from the supply zone of $18 and pushed from the highs. Additionally, the stock has slipped to the demand zone and is attempting to settle the gains amidst the selling pressure. However, the stock must sustain above the 200-Day EMA for a healthy comeback.
Summary
Riot Platforms (RIOT) stock implies sharp volatility and is trying for a rebound above $12 for the past sessions. Buyers have held the gains near $10, and multiple doji candlesticks were formed, which shows the indecisiveness between them. Moreover, the stock did not breach the demand zone and witnessed a rebound, which may extend soon.
Technical Levels
Support Levels: $11 and $10.50
Resistance Levels: $12 and $12.70
Disclaimer
The views and opinions stated by the author or any other person named in this article are for informational purposes only and do not constitute financial, investment, or other advice. Investing in or trading crypto or stocks comes with a risk of financial loss.

Andrew is a blockchain developer who developed his interest in cryptocurrencies while pursuing his post-graduation major in blockchain development. He is a keen observer of details and shares his passion for writing, along with coding. His backend knowledge about blockchain helps him give a unique perspective to his writing skills, and a reliable craft at explaining the concepts such as blockchain programming, languages and token minting. He also frequently shares technical details and performance indicators of ICOs and IDOs.


