
 Home
Home News
News

- 1 The Hedera Hashgraph coin price is heading downward, showcasing bullishness.
- 2 The HBAR price has broken below the key moving averages on the daily timeframe.
- 3 The Hedera Hashgraph coin price fell by 4.95% in the current week and it seems like bears are getting back on track.
The Hedera Hashgraph coin price fell by 7.55% in the current week and showed initial signs of correction. It formed a giant bearish candle that engulfed the majority of gains generated from November to December 2023.

Buyers of HBAR are struggling to hold the price above the key EMAs. Moreover, the HBAR price lost momentum and reverted in a downward direction.
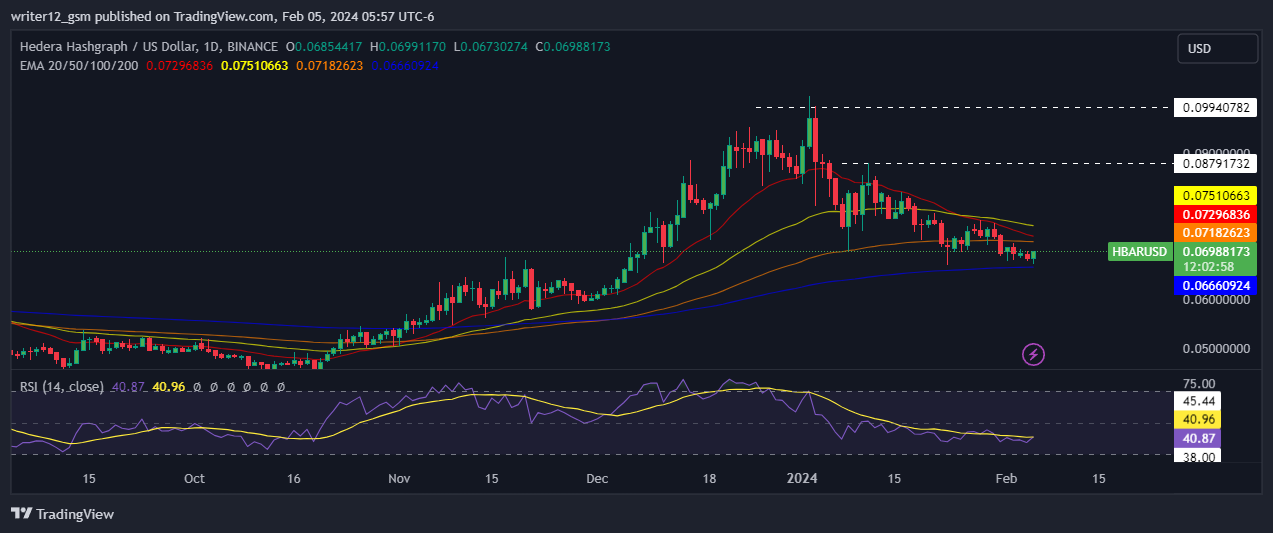
The HBAR coin price lost bullish force near $0.09940782 and sellers stepped in to push the price downward. The recent sharp drop in this crypto is backed by a high selling volume. This means that some investors have exited and cashed out their investments.
If the HBAR price falls lower, existing investors may get scared and outflow may continue. On the lower side, the $0.0666087 level is one of the swing-low supports seen on the chart. The bears may soon attack this level and try to snatch control from the buyers.
However, if buyers are active and manage to defend the support level, then there could be a wild move in an upward direction.
Currently, the EMAs are acting as support. However, because of the strong resistance of sellers, the EMA support is getting weaker, so a breakdown may occur. Currently, the HBAR crypto is trading at $0.06988173 with a one-day loss of 1.94%.
Sharp Drop in Hedera Hashgraph Coin; Has the Trend Turned Bearish?
The Hedera crypto entered into a correction phase because it broke the chain of higher high swings. The next phase of the drop may occur if sellers manage to snatch control at the lower levels.
The confirmation of the bearish trend will arrive when the price closes below the 50-day and 200-day EMAs.
Sellers look very fierce, so the chance of more price drops is significantly high. Therefore, short-term traders should look for sell-on-rise opportunities as long as the price trades below $0.07182623.
The RSI is at 40 and dives downward, indicating weakness. A further drop might push the price into oversold territory. The MACD curve reverses down and the histogram bar is red, indicating that the price may continue to move with a bearish outlook.
The Hedera Hashgraph coin price is in the bears’ grip and no signs of a bounceback are visible. The price action of this crypto has turned bearish, which means that investors may cash out at any time.
Summary
The Hedera Hashgraph coin price is turning bearish. The sellers are ruling so they may drag the price even lower to $0.0600. The analysis suggests that investors should look for sell-on-rise opportunities until reliable signs of a bounce are visible.
Technical levels
Resistance level: $0.08791732.
Support level: $0.6660924.
Disclaimer
This article is for informational purposes only and does not provide any financial, investment, or other advice. The author or any people mentioned in this article are not responsible for any financial loss that may occur from investing in or trading. Please do your own research before making any financial decisions
Anurag is working as a fundamental writer for The Coin Republic since 2021. He likes to exercise his curious muscles and research deep into a topic. Though he covers various aspects of the crypto industry, he is quite passionate about the Web3, NFTs, Gaming, and Metaverse, and envisions them as the future of the (digital) economy. A reader & writer at heart, he calls himself an “average guitar player” and a fun footballer.


