
 Home
Home News
News
- 1 The JUP crypto is ready for a huge surge, as it is gearing up to break the resistance level and reach new highs from the current support zone.
- 2 The MACD indicator is also showing bullishness, as it has a bullish crossover with the histogram rising.
JUP crypto price has been on an uptrend since last week, displaying a 1684% increase on the hourly chart. It rose by 17% from $0.5509 to $0.6500 on February 1st, 2024, subsequently it faced resistance and dropped to $0.5220.
The current price is $0.5341, down by 1.22% in the last 24 hours. However, the JUP crypto is showing signs of recovery, as it is holding on to a key support level of around $0.5220 on the chart.
The JUP crypto is ready for a huge surge, as it is gearing up to break the resistance level and reach new highs from the current support zone of $0.5220. In addition, the price structure is showing a possible bullish pattern known as a declining wedge.
The JUP crypto chart is reflecting bullish power and strong potential as it is approaching major EMAs on the 1-Hour chart.
Can Jupiter Crypto Price Skyrocket?
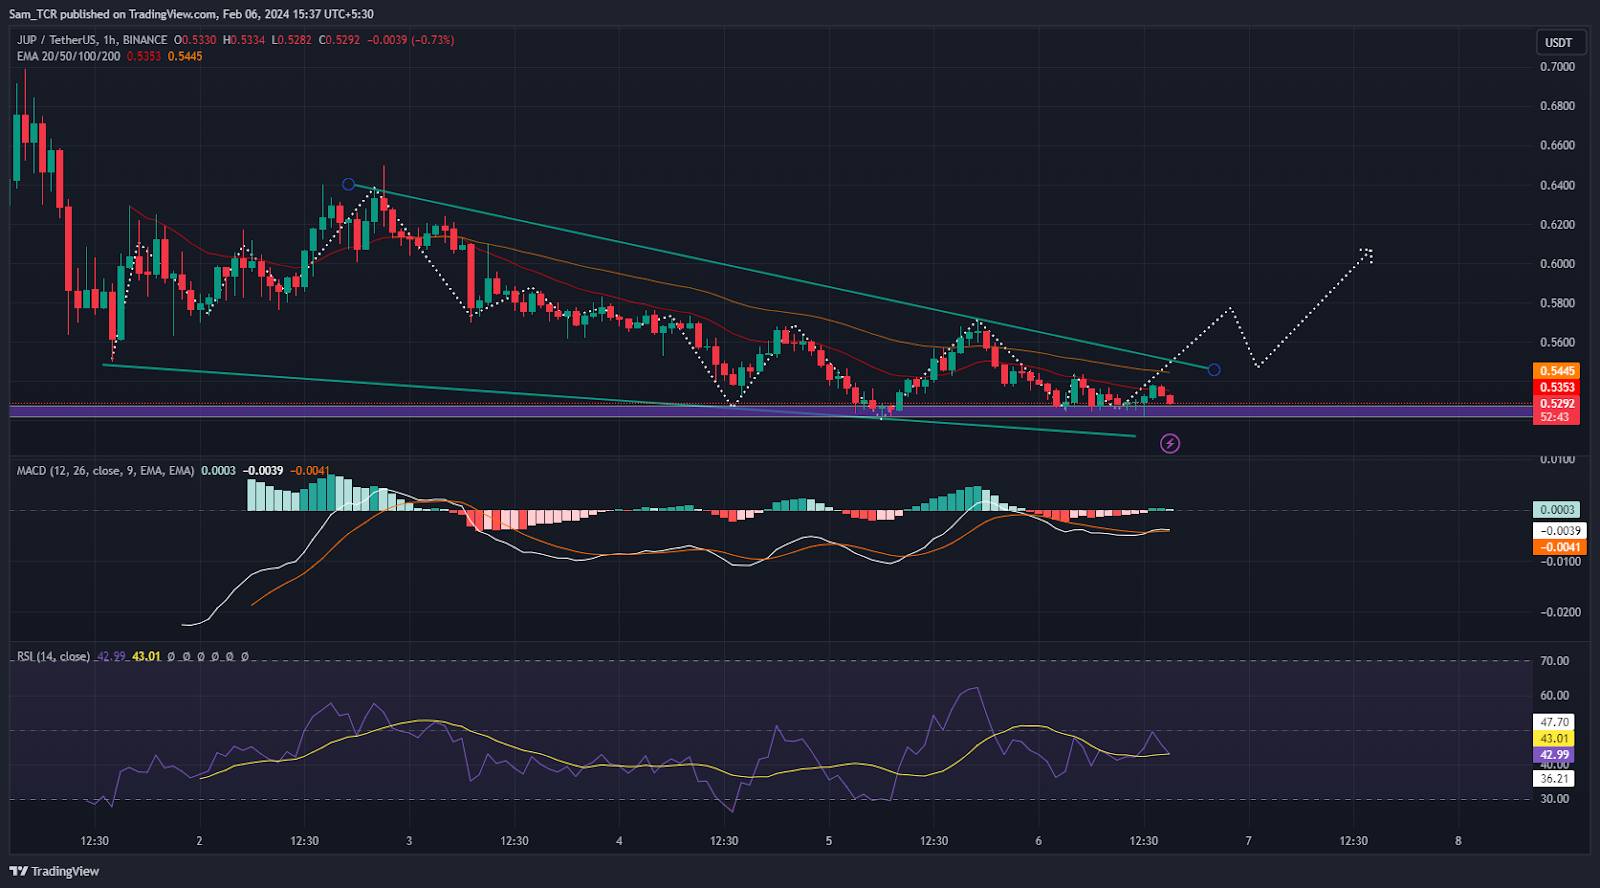
The RSI is indicating that the JUP crypto has more room to grow. The RSI curve is above the 14-SMA and the values are 46 and 42, respectively.
The MACD indicator is also showing bullishness, as it has a bullish crossover with the histogram rising. The histogram value is 0.0005, the MACD value is -0.0036, and the signal line value is -0.0041.
Therefore, if the demand for the JUP increases, the price could rise from the current level. The next major target for the price would be $1.00, and the main resistance levels along the way would be $0.6500.
However, if the JUP crypto price falls below the $0.5220 level, it could fall further and reach lower levels.
Summary
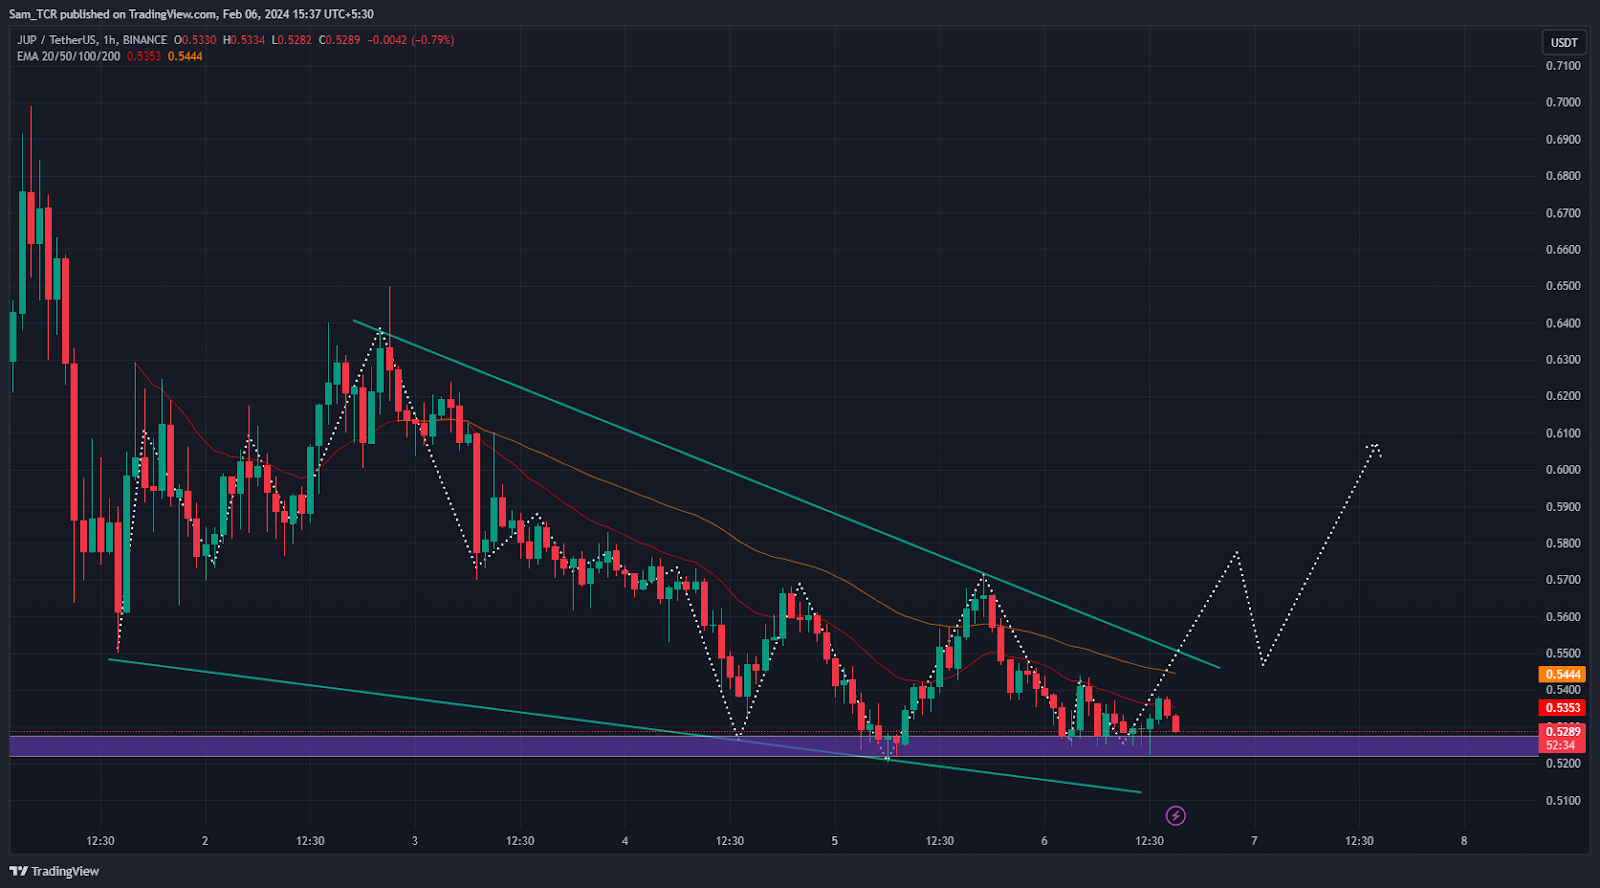
Jupiter crypto price chart highlights the bearish sentiments and perspectives regarding the crypto asset in the hourly time frame. The JUP crypto price action highlights a bearish view at the time of publishing, as it recently slumped from a supply level.
Moreover, the technical parameters of the Jupiter crypto price suggest the continuation of the downward trend, reliant on the seller’s surge, over the daily time frame chart. The RSI and EMAs suggest and portray bearish gestures regarding the JUP asset price.
Technical Levels
Support Levels: $0.5220
Resistance Levels: $0.6500
Disclaimer
In this article, the views, and opinions stated by the author, or any people named are for informational purposes only, and they don’t establish the investment, financial, or any other advice. Trading or investing in cryptocurrency assets comes with a risk of financial loss.

Adarsh Singh is a true connoisseur of Defi and Blockchain technologies, who left his job at a “Big 4” multinational finance firm to pursue crypto and NFT trading full-time. He has a strong background in finance, with MBA from a prestigious B-school. He delves deep into these innovative fields, unraveling their intricacies. Uncovering hidden gems, be it coins, tokens or NFTs, is his expertise. NFTs drive deep interest for him, and his creative analysis of NFTs opens up engaging narratives. He strives to bring decentralized digital assets accessible to the masses.


