
 Home
Home News
News
- 1 The OOE token price showcases uncertain moves and is waiting for a reversal.
- 2 The buyers are holding the gains and trying to surpass the 50-day EMA hurdle.
The OpenOcean (OOE) token noted retracement from the highs of $0.02600 and has retested the 200-day EMA mark in the last sessions. However, the breakdown was not clicked below the crucial support zone of $0.012000, and buyers immediately led a pullback. Additionally, if the token escapes the trendline barrier of $0.016000, it may spike toward $0.02000 shortly.
The OOE token price conveys profit booking and forms lower low swings for the past sessions, signifying selling pressure on the charts. However, the token is ready for a comeback and is poised near $0.012000. Furthermore, the token forms a symmetrical triangle pattern close to the 50-day EMA mark, revealing indecisiveness between the bulls and bears.
The cryptocurrency price was $0.001432 at press time, with an intraday gain of 3.60%, showing neutrality on the charts. Moreover, the trading volume increased by 15.81% to $176,898, highlighting low investor interest. The pair of OOE/BTC was noted at 0.000000334 BTC and the market cap is $7.24 Million. Analysts are neutral and suggest that the OpenOcean (OOE) price might attain a pullback in the following sessions.
OOE on Daily Charts Displays a Symmetrical Triangle Pattern
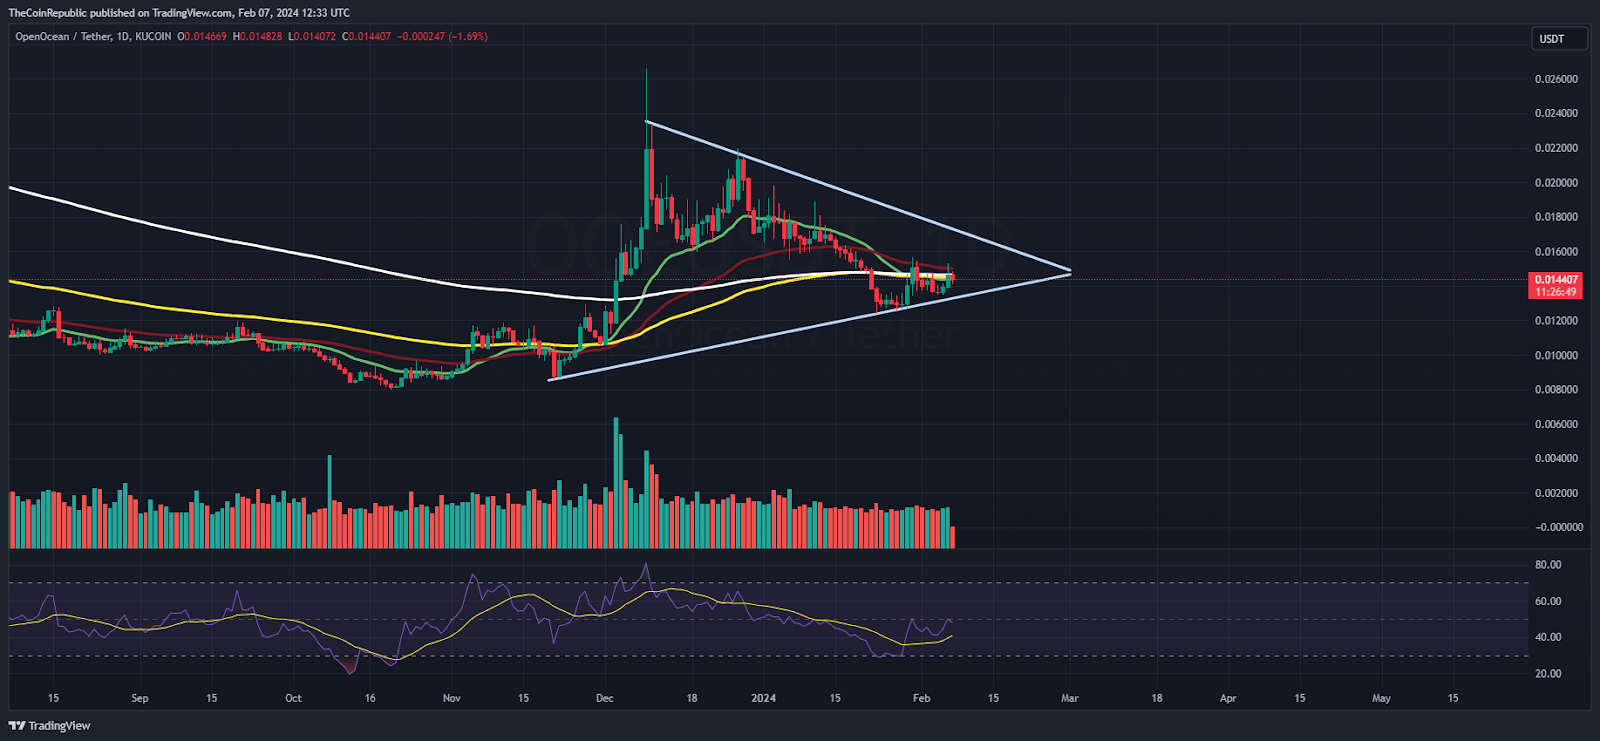
On the daily charts, the OOE token price signifies a retracement and has retested the support zone of $0.012000 in the past sessions. However, the correction comes to an end and the token might attain a rebound above the trendline hurdle of $0.016000. Additionally, the token is well poised for a short covering move and the technicals signal a favorable buy-on-dips opportunity for the investors.
The Relative Strength Index (RSI) curve stays in the oversold region, indicating a correction for the past sessions. Moreover, the Moving Average Convergence Divergence (MACD) indicator shows a convergence of the MA line with the signal line, delivering indecisive moves on the charts. Per the Fib levels, the OOE price has sustained above the 23.6% zone and is close to surpassing the 38.2% level.
OOE on Weekly Charts Exhibits Falling Channel
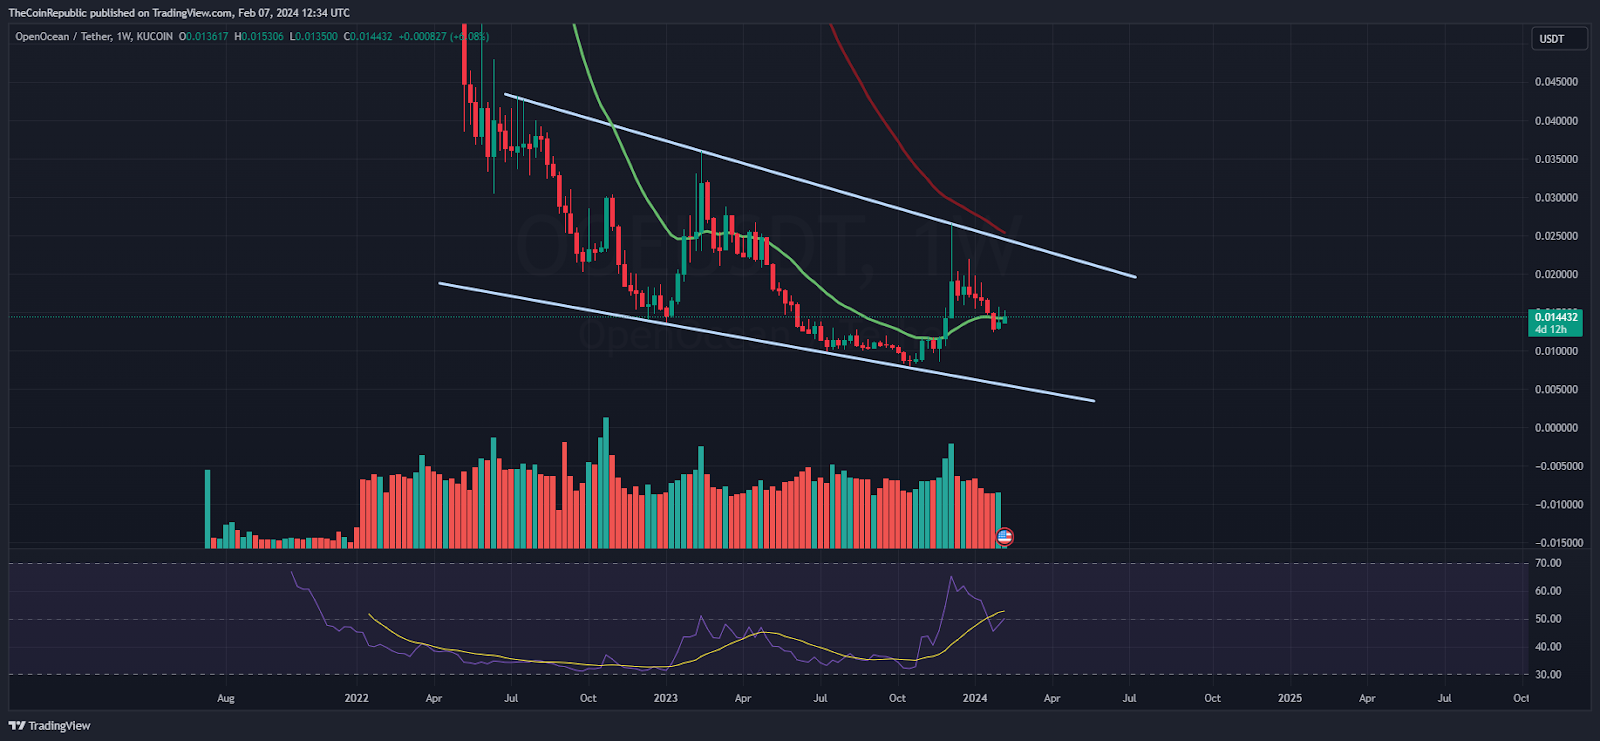
On the weekly charts, the OpenOcean crypto price persisted in forming the lower low formation. It is sustaining gains on the critical support zone of the 20-day EMA mark. Additionally, a falling channel pattern was witnessed. It suggests if any comeback happens, the token may retest the highs of the channel near $0.016000, whereas if any slippages happen, it may drag to $0.012000 soon.
Summary
The OpenOcean (OOE) token price is close to surpassing the 50-day EMA and is delivering a range-bound move amidst the retracement from the highs. Moreover, the token is ready for a blast above the trendline hurdle of $0.016000 and may attain a rebound shortly.
Technical Levels
Support Levels: $0.012000 and $0.01000
Resistance Levels: $0.016000 and $0.018000
Disclaimer
The views and opinions stated by the author or any other person named in this article are for informational purposes only and do not constitute financial, investment, or other advice. Investing in or trading crypto or stocks comes with a risk of financial loss.
Anurag is working as a fundamental writer for The Coin Republic since 2021. He likes to exercise his curious muscles and research deep into a topic. Though he covers various aspects of the crypto industry, he is quite passionate about the Web3, NFTs, Gaming, and Metaverse, and envisions them as the future of the (digital) economy. A reader & writer at heart, he calls himself an “average guitar player” and a fun footballer.


