
 Home
Home News
News
- 1 The TEL coin showcased a selloff and is replicating the downtrend on the charts.
- 2 Sellers look aggressive and are trying to push the coin price toward the demand zone.
The Telcoin (TEL) price witnessed distribution from the highs and eroded over 60% of gains in recent weeks. Moreover, the coin was in a correction phase and may extend the decline amidst the negative market sentiments. Furthermore, the coin persisted in facing rejection from the 20-day EMA and breached $0.0013000, which is a negative sign.
The TEL coin price has slipped below the key moving averages, revealing selling pressure for the past sessions. The mighty bears have attained momentum and continued to push from the highs. Additionally, the bears have continued adding short positions and show their legacy. The price action signifies follow-on selling momentum and is delivering a downtrend.
The cryptocurrency price was $0.001203 at press time, with an intraday gain of 1.27%, showing bearishness on the charts. Moreover, the trading volume increased by 0.67% to $349398, highlighting selling pressure. The pair of TEL/BTC was noted at 0.0000000281 BTC and its market cap is $141.10 Million. Analysts are bearish and suggest that the Telcoin (TEL) price will continue to extend the decline and may retest the demand zone of $0.0010000 in the following sessions.
Telcoin on Daily Charts Displays Bearishness
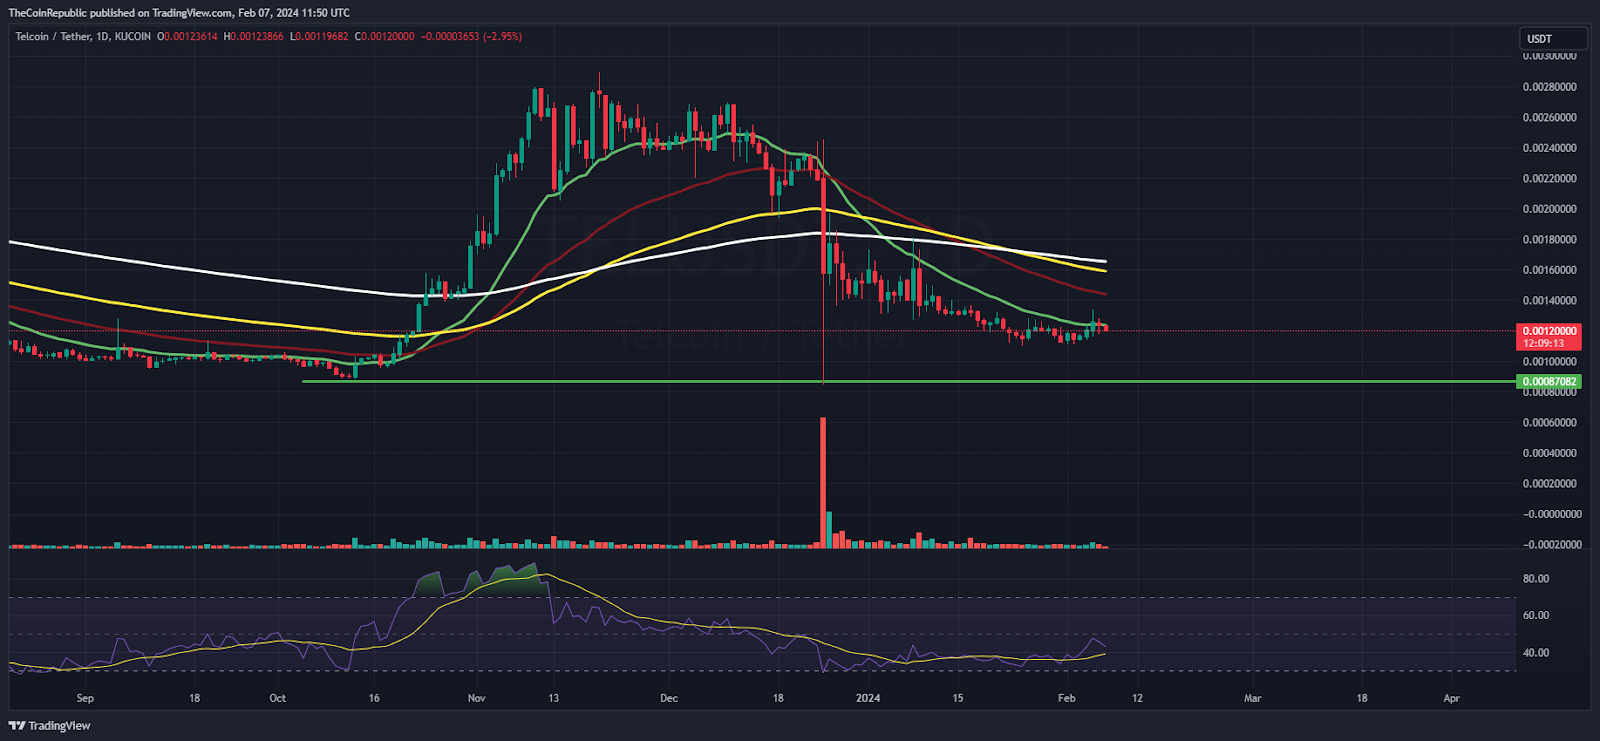
On the daily charts, the Telcoin price has breached the critical support zone of $0.0014000 and exhibited a breakdown in the past weeks. Additionally, a double top pattern was noted near the highs of $0.0028000 and sharp distribution got buyers trapped. Recently, a rejection wick was formed near $0.001000 during the breakdown and it may be retested soon.
The Relative Strength Index (RSI) curve stays in the oversold region and forms a negative divergence, indicating a downtrend. Moreover, the Moving Average Convergence Divergence (MACD) indicator shows a bearish crossover and formed red bars on the histogram, conveying the sellers’ dominance. Per the Fib levels, the TEL coin price has breached the 38.2% zone and is close to breaking the 23.6% mark.
TEL on Weekly Charts Exhibits Rejection from the Supply Zone
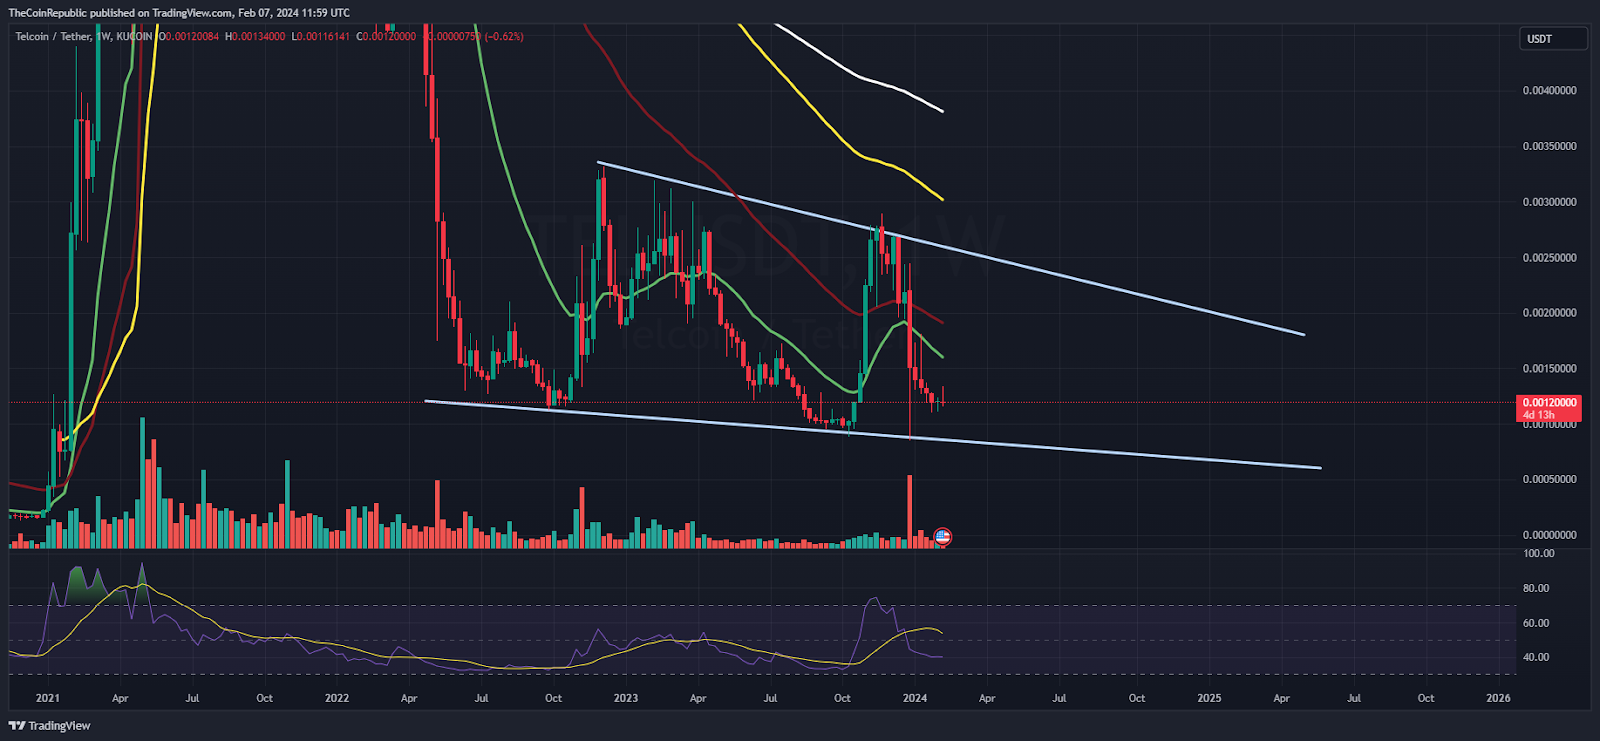
On the weekly charts, the TEL coin price formed a falling channel pattern, and a sharp rejection from the supply zone of $0.0028000 was noted. Afterward, follow-on selling pressure was continued and roller coaster moves were glimpsed in the recent sessions. Additionally, the coin price has slipped below its make-or-break zone of $0.0015000, which indicates that sellers have gained strength. They may continue to push the TEL price toward the demand zone.
Summary
The Telcoin (TEL) price noted distribution from the highs and was in a correction phase over the past few weeks. Moreover, the coin exhibited bearishness and an intense selloff was shown on the charts.
Technical Levels
Support Levels: $0.001000 and $0.000900
Resistance Levels: $0.0013000 and $0.0015000
Disclaimer
The views and opinions stated by the author or any other person named in this article are for informational purposes only and do not constitute financial, investment, or other advice. Investing in or trading crypto or stocks comes with a risk of financial loss.

Andrew is a blockchain developer who developed his interest in cryptocurrencies while pursuing his post-graduation major in blockchain development. He is a keen observer of details and shares his passion for writing, along with coding. His backend knowledge about blockchain helps him give a unique perspective to his writing skills, and a reliable craft at explaining the concepts such as blockchain programming, languages and token minting. He also frequently shares technical details and performance indicators of ICOs and IDOs.


