
 Home
Home News
News
- 1 The RENQ crypto displayed a down move and is displaying distribution from the highs.
- 2 RENQ price slips to the bearish region and is showing a correction.
The RENQ price delivers bearishness and has slipped below the 20-day EMA mark. The price slipped to the bearish region and displayed selling pressure for the past sessions. RENQ crypto’s price action reveals follow-up selling pressure and is witnessing rejection from the supply zone of $0.013000, from where RENQ crypto corrected over 40% in the last weeks. Additionally, the bears are looking aggressive and trying to beat the demand zone of $0.00770 to initiate a massive fall.
The RENQ price slipped below the key moving averages and is delivering a downtrend on the charts. Furthermore, the crypto signifies the lower lows formation and has retested the demand zone of $0.007700 in the last session. However, the RENQ crypto price seems oversold and a bounce can be anticipated toward $0.008000 for the short term. Additionally, multiple doji candlesticks were formed, which is a sign of bottom formation. The correction may end now.

At press time, RENQ Finance (RENQ) is trading at $0.007795 with an intraday drop of 0.35%, showing a downtrend. Moreover, the trading volume jumped by 3.25% to $225,675, highlighting selling pressure. The pair of RENQ/BTC was noted at 0.000000166 BTC, while the market cap is $7.79 Million. Analysts are bearish and suggest that the RENQ price will face further correction in the upcoming sessions.
RENQ on Daily Charts Displays Rejection from the Supply Zone
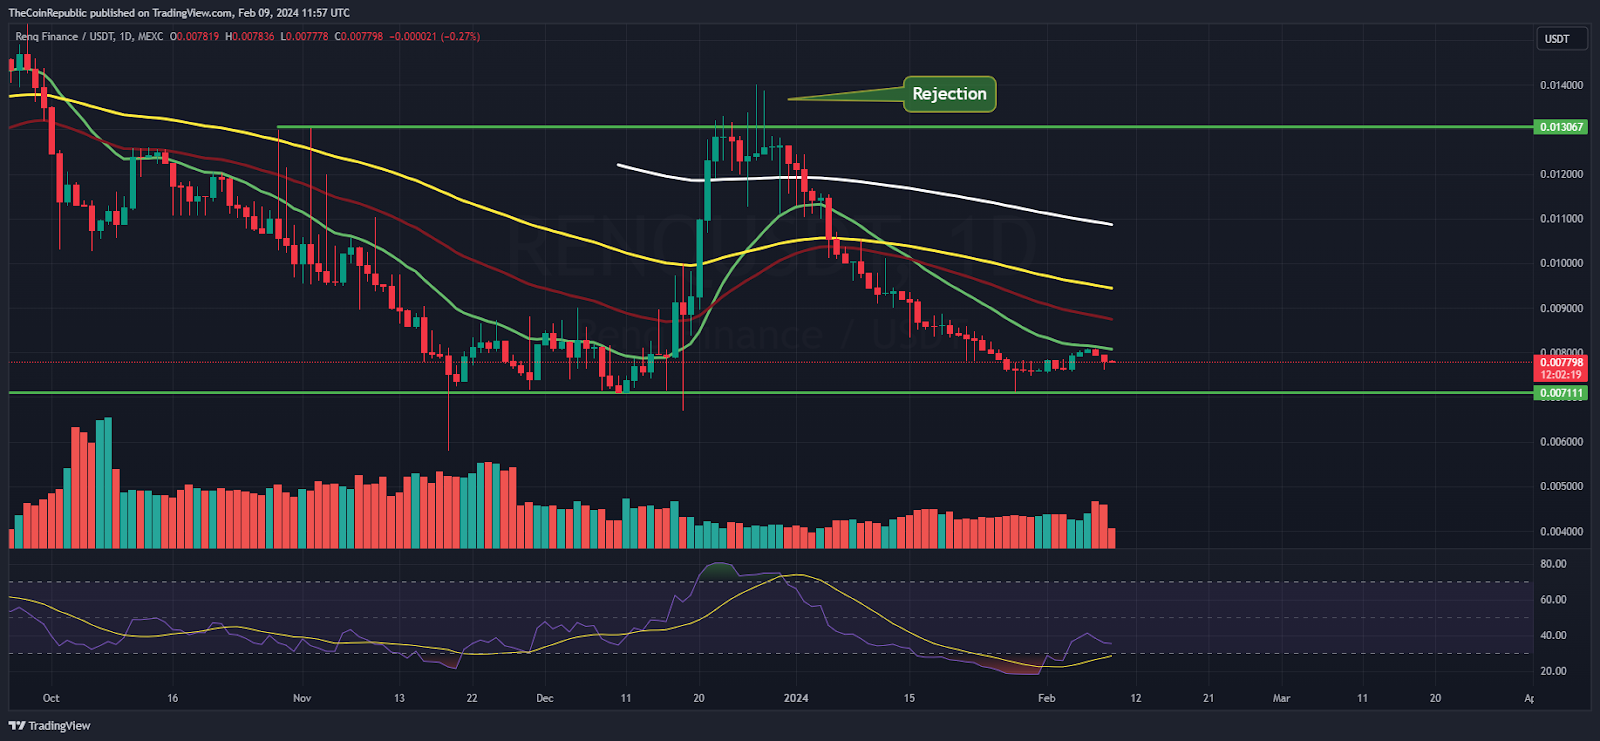
On the daily charts, the Renq Finance (RENQ) price displays distribution from the top and shows volatility for the past sessions. Moreover, the price action conveys the short buildup, and buyers must secure the $0.007800 to acquire bounce. Conversely, if sellers continue to stretch the down move below $0.007750, it will soon retest the lows of $0.007600.
The Relative Strength Index (RSI) curve stays in the oversold region and suggests a pullback for the following sessions. Moreover, the MACD indicator shows a bearish crossover and formed red bars on the histogram, presenting the bears’ dominance on the charts.
RENQ on Weekly Charts Exhibits Range Bound Movements
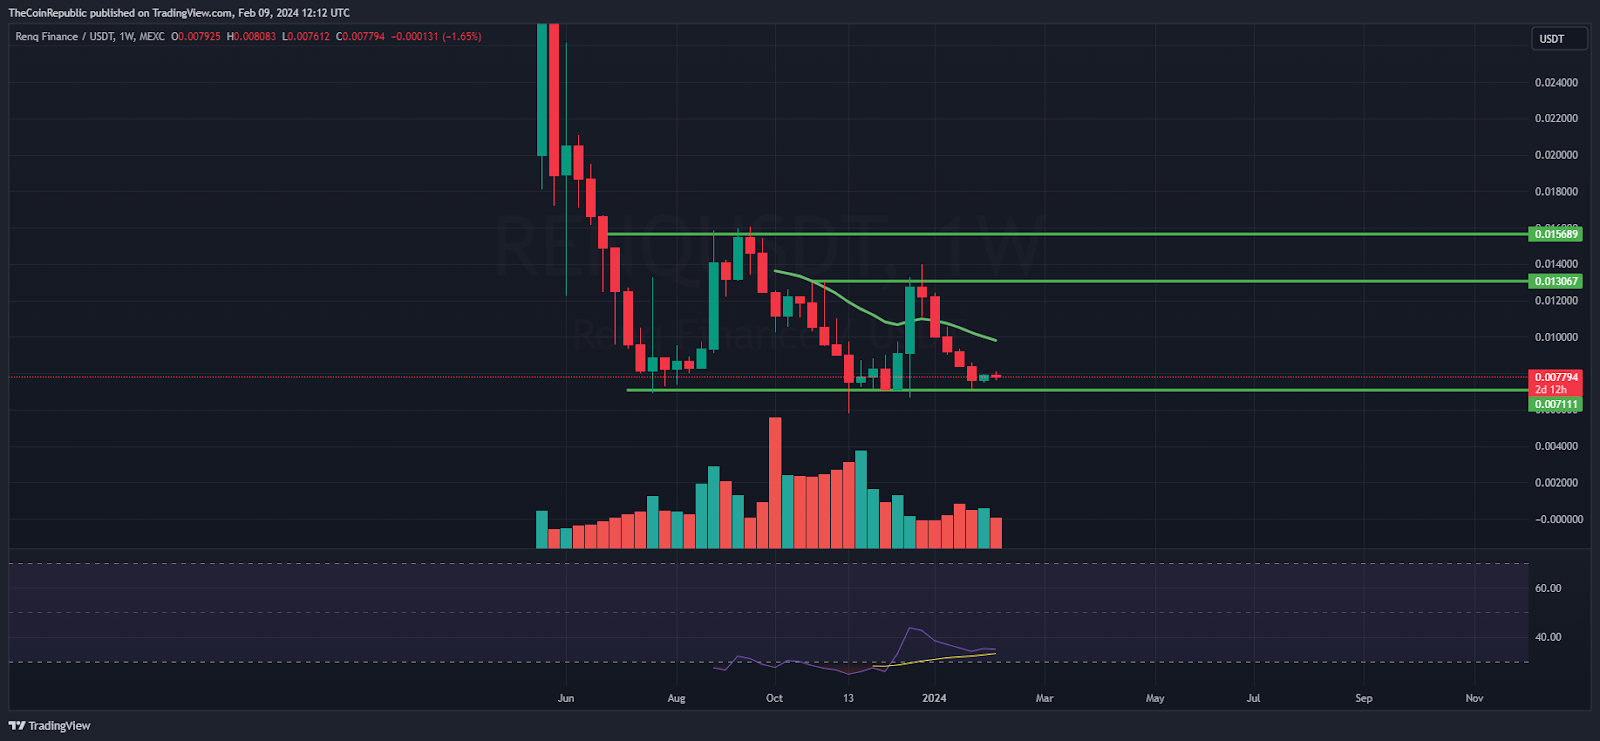
On the weekly charts, the RENQ price displays a roller coaster move inside a narrow range and depicts a dilemma among investors for the past sessions. Investors are worried now, seem trapped due to the volatile price action, and are awaiting a clear direction. Moreover, the crypto price trades below the 20-day EMA mark, which conveys a downtrend.
Summary
The Renq Finance (RENQ) crypto price signifies a down move and replicates correction from the supply zone of $0.013000, which trapped the bulls. Moreover, the trend is weak and bulls must crack the prompt hurdle of $0.007900 to initiate a pullback for the coming sessions.
Technical Levels
Support Levels: $0.007750 and $0.007700
Resistance Levels:$0.007900 and $0.008000
Disclaimer
The views and opinions stated by the author or any other person named in this article are for informational purposes only and do not constitute financial, investment, or other advice. Investing in or trading crypto or stocks comes with a risk of financial loss.
Steve Anderson is an Australian crypto enthusiast. He is a specialist in management and trading for over 5 years. Steve has worked as a crypto trader, he loves learning about decentralisation, understanding the true potential of the blockchain.


