
 Home
Home News
News
- 1 AMP token maintained the gains and is taking support on the upward trendline.
- 2 Buyers are anticipating a pullback and are looking to retain $0.00400.
The AMP token was in a downtrend and reflected a pullback from the lows of $0.001500, recovering over 120% amidst the adverse market sentiments. The token depicts a symmetrical triangle pattern close to the trendline support zone of $0.003500 near the 20-day EMA mark. However, the buyers continued accumulating the token from the bottom, stretching the rebound.
The AMP price is trading in the neutral region and is waiting for an up move to register a breakout above the trendline hurdle of $0.003800. However, the sellers are trying to wipe out the gains and the bulls’ strength. The token witnessed retracement from its highs of $0.004700 and saw lower highs and lower lows sequences justified profit booking at the highs.
The Amp token (AMP) price was $0.0036100 at press time, with an intraday drop of 2.71%, showing neutrality on the charts. Moreover, the trading volume increased by 4.13% to $863,212 Million, highlighting the buyers’ accumulation. The pair of AMP/BTC is at 0.0000000753 BTC, and the market cap is $321.53 Million. Analysts are neutral and suggest that the AMP crypto price will gain momentum and may lift the gains above $0.004000 soon.
AMP on Daily Charts Depicts Symmetrical Triangle Formation
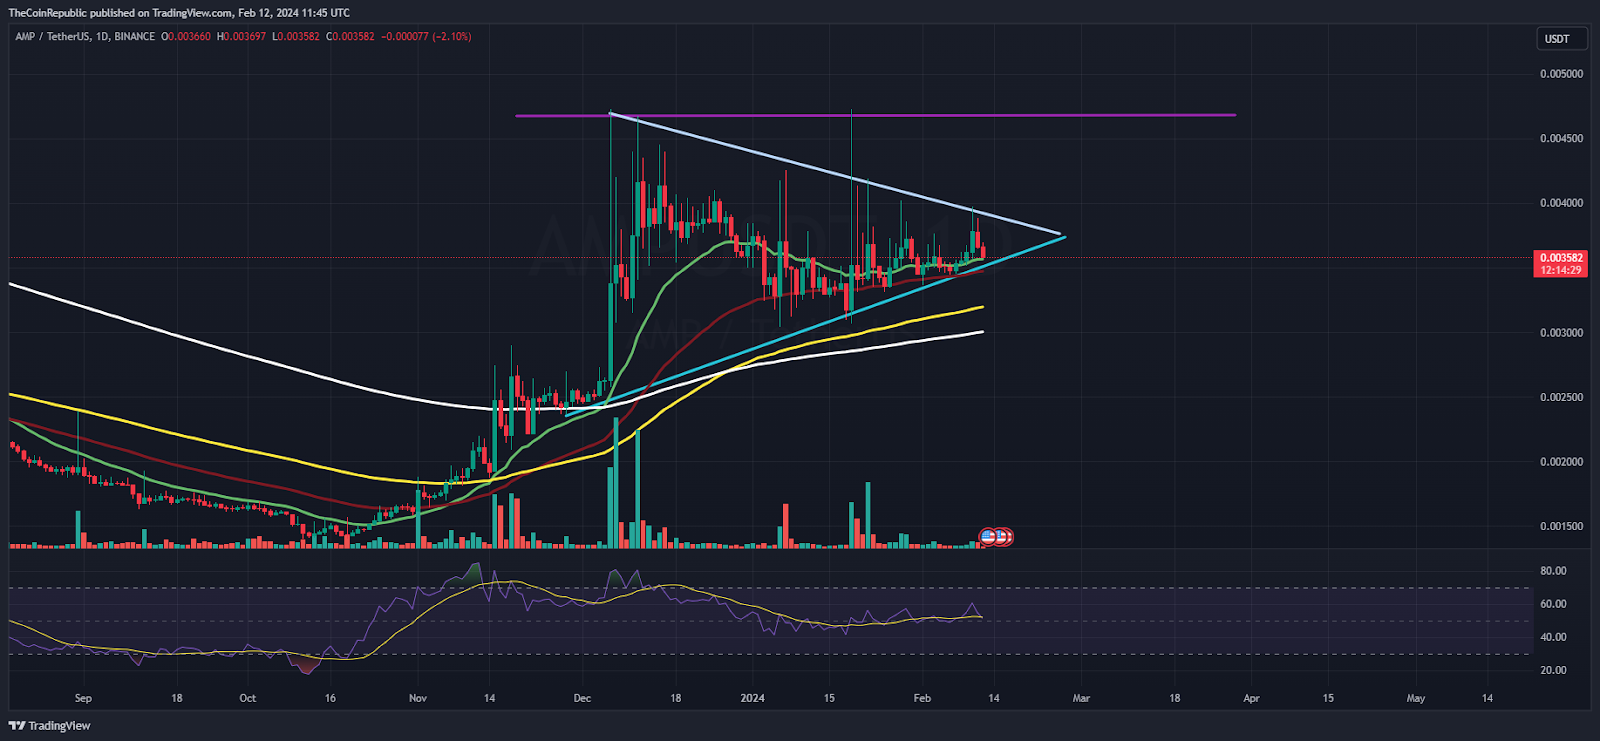
On the daily charts, the AMP crypto price held gains above the 20-day EMA mark, and investors are awaiting an upward move to add their long positions. If the token smashes the upper trendline of $0.003800, it will gain momentum and rise toward $0.004000, followed by $0.004200 shortly. Conversely, if the lower trendline splits, the token may retest the prompt support zone of $0.003300 and $0.003100.
The Relative Strength Index (RSI) curve stays near 50, showing a neutral perspective and suggesting that the token is ready for a significant move. The MACD indicator shows a convergence of the MA line with the signal line, redirecting the pause before the massive move.
AMP On Weekly Charts Exhibits Rejection From 50 Day EMA
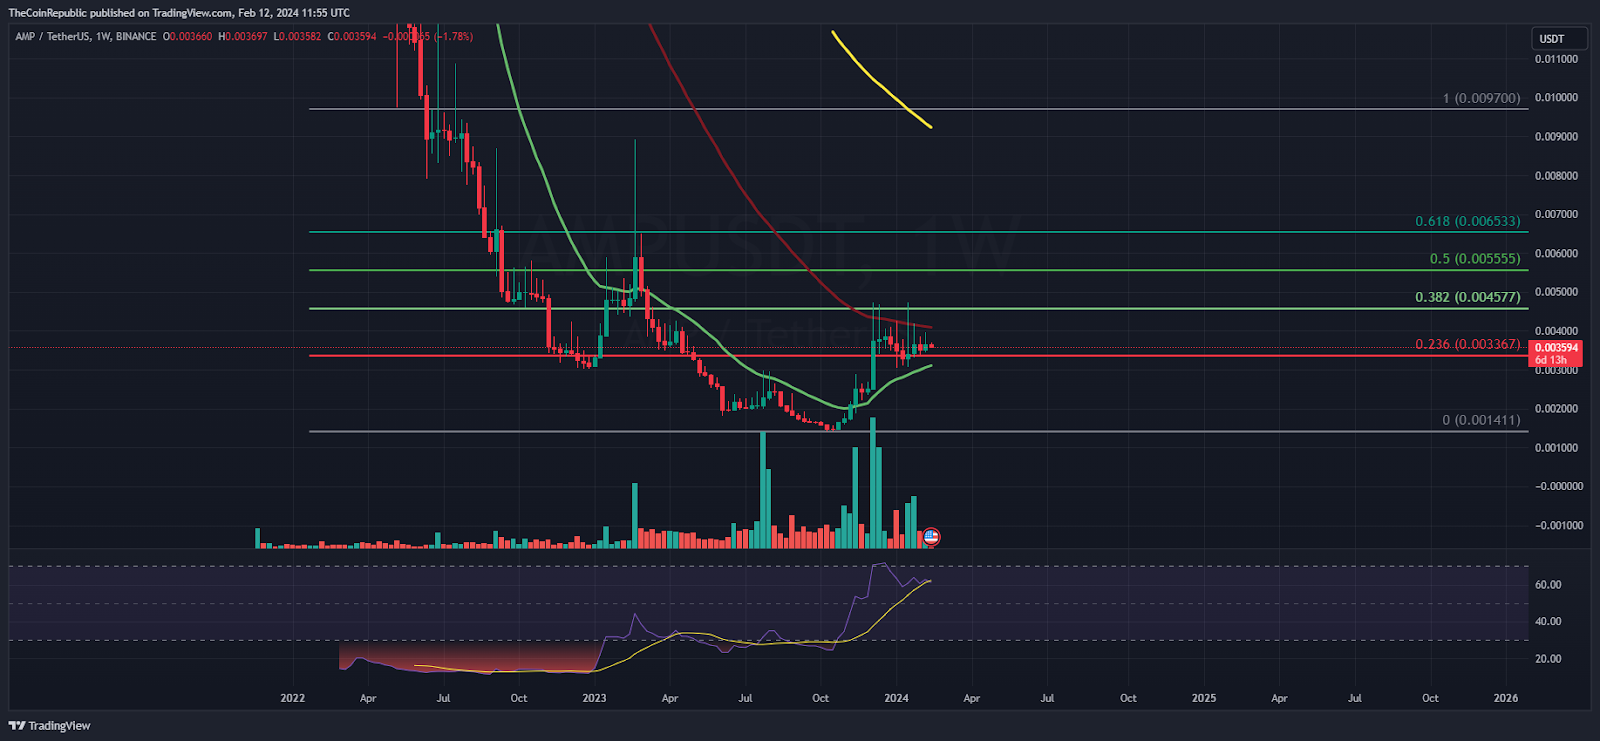
On the weekly charts, buyers tried multiple times to surpass the 38.2% Fibonacci retracement zone but failed and faced rejection from the 50-day EMA mark. Additionally, the trend is negative, and sellers did not permit the bulls to attain strength, which resulted in a decline.
Summary
AMP price is trading close to the 20-day EMA mark and is looking to split the pattern trendline to register a move. Investors are eyeing it closely to add fresh positions and are awaiting an up move. However, the trend is negative, and buyers are looking scared because of the fakeouts that happened in the past sessions.
Technical Levels
Support Levels: $0.003400 and $0.003100
Resistance Levels:$0.003600 and $0.003800
Disclaimer
The views and opinions stated by the author or any other person named in this article are for informational purposes only and do not constitute financial, investment, or other advice. Investing in or trading crypto or stocks comes with a risk of financial loss.
Steve Anderson is an Australian crypto enthusiast. He is a specialist in management and trading for over 5 years. Steve has worked as a crypto trader, he loves learning about decentralisation, understanding the true potential of the blockchain.


