
 Home
Home News
News
- 1 BEAM token reflects bullishness and it will sparkle fireworks soon.
- 2 Buyers have persisted in accumulation and are trying to hit a new high.
The BEAM price retested the highs of $0.02700, met rejection, and stayed in the bullish trajectory, reflecting buying momentum on the charts. Moreover, the token is glad to surpass the ATH (all-time high) and is eyeing $0.03000 to reach soon. Bulls are looking strong and are peeking to stretch the upside above $0.02750 to gain traction. The token is glimpsing bullishness and is reflecting the bulls’ dominance.
The BEAM token is trading above the significant moving averages and is delivering a solid uptrend for the past sessions. Amidst the neutral market sentiments, the BEAM crypto did not cease the up move and endured in stretching the up move. Furthermore, the buyers are keen to reach the round mark of $0.03000 and continue to accumulate.
The cryptocurrency price was $0.02526 at press time, with an intraday drop of 2.11%, showing bullishness on the charts. Moreover, the trading volume increased by 4.71% to $76.12 Million, highlighting the buying momentum. The pair of BEAM/BTC is at 0.000000528 BTC, and the market cap is $1.29 Billion. Analysts are bullish and suggest that the BEAM crypto (BEAM ) price will continue to gain momentum and may skyrocket gains above $0.02800 soon.
BEAM On Daily Charts Displays Buying Momentum
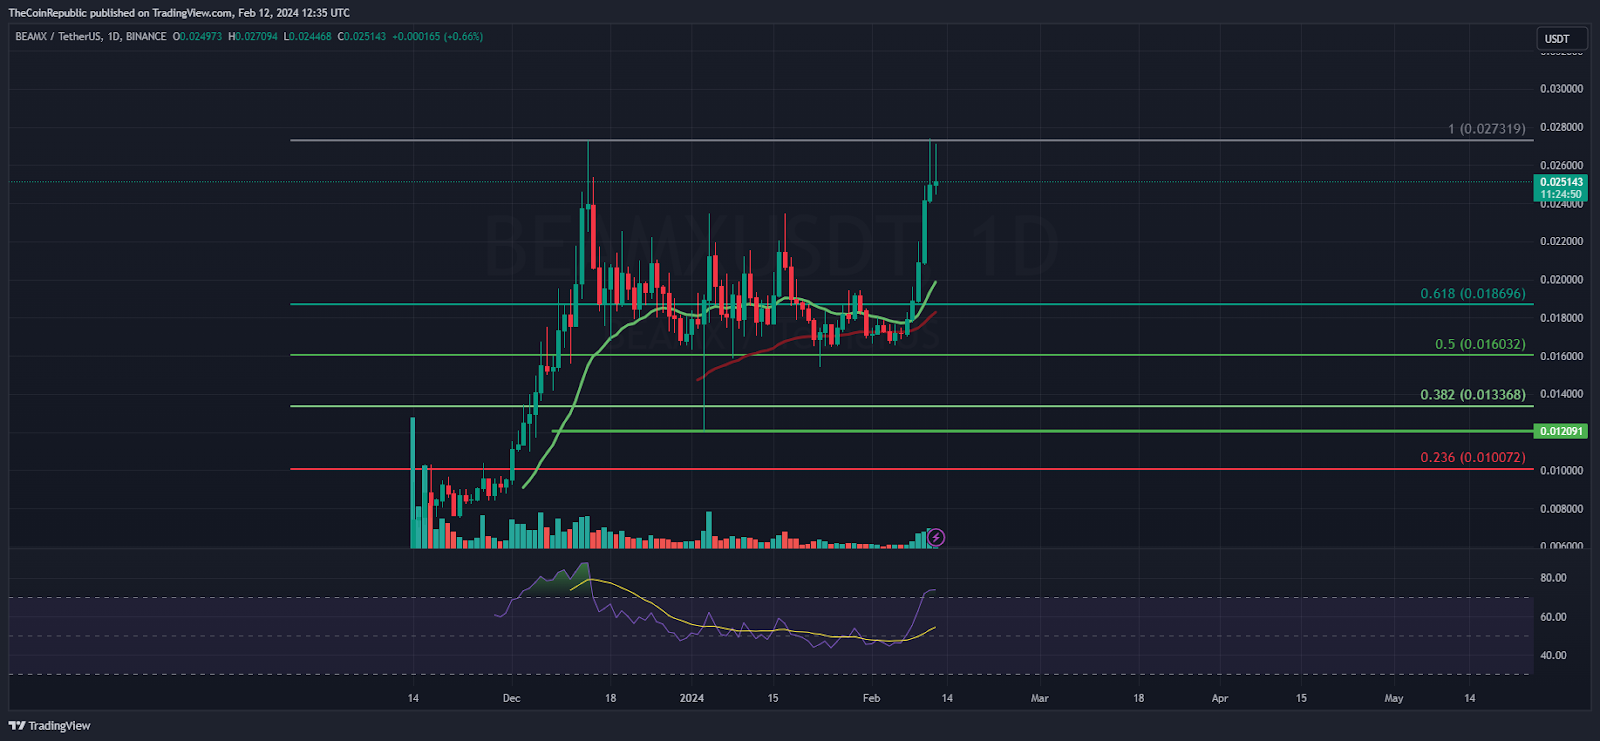
On the daily charts, the token price stayed in the bullish trajectory and is on the verge of the upper Bollinger band. It suggests that a breakout can be anticipated in the coming sessions. The price action signifies the bullish stance and displays a pullback from the 20-day EMA in the last sessions.
The Relative Strength Index (RSI) curve stays in the overbought zone, displays a positive divergence, and suggests a continuation of buying momentum for the upcoming sessions. Similarly, the MACD indicator shows a bullish crossover and forming green bars on the histogram revealing the bulls dominance. Per the Fib extension, if the token succeeds in scratching $0.02750, it may go ahead to $0.02950, followed by $0.03050 soon.
BEAM on Hourly Charts Retested Support at 50-day EMA
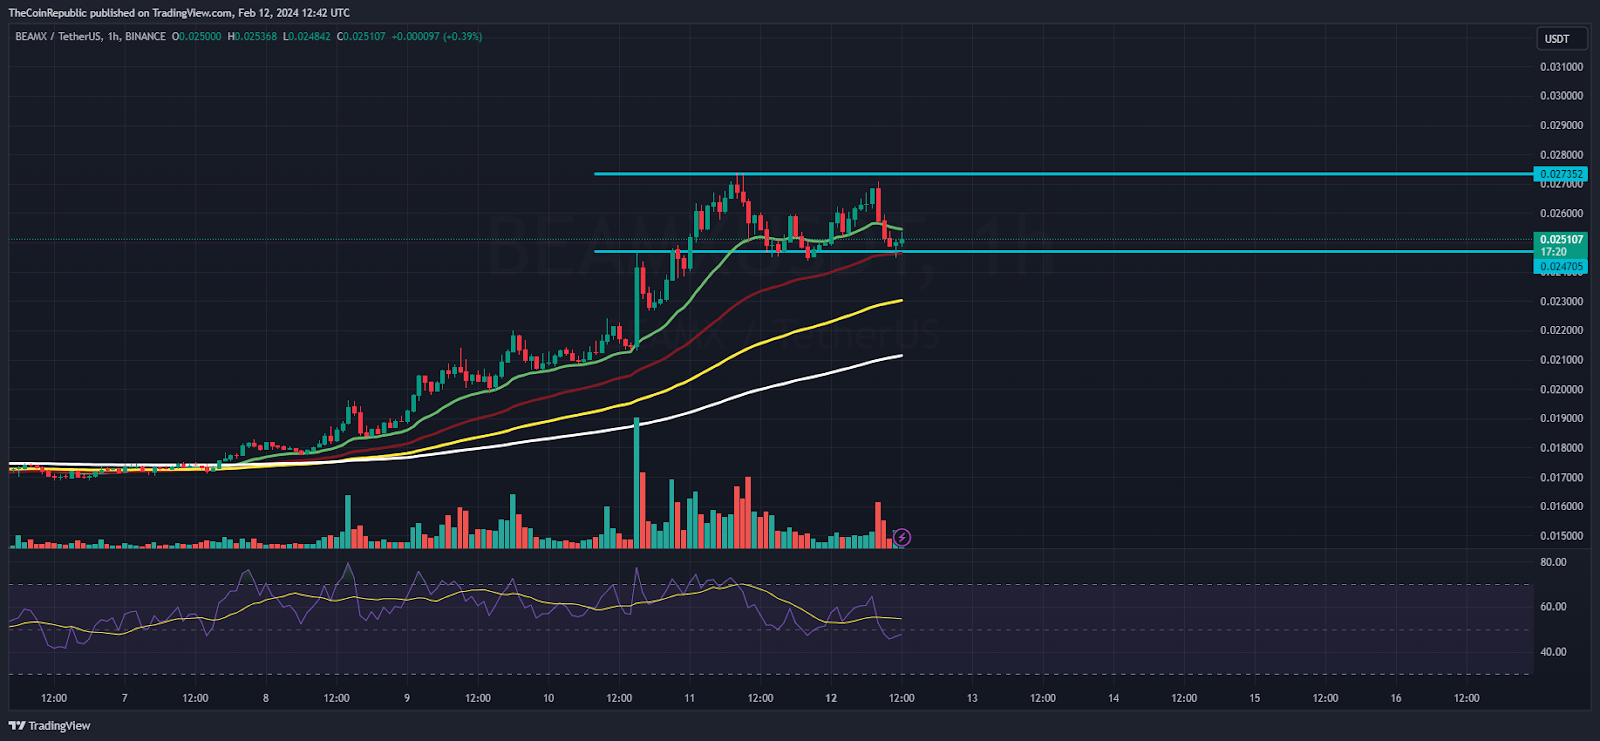
On the hourly charts, the token displays a range-bound move near the highs and is waiting to crack out the upside of $0.02750 in the following sessions. However, the token has retested its 20-day and 50-day EMA mark and is poised to hit a new high soon. The technicals are revealing a bullish crossover and are signalling an upside for the upcoming sessions.
Summary
The BEAM crypto witnessed buying momentum and stayed in bullish territory, reflecting bulls’ dominance on the charts. Moreover, the token is poised to make a new high and investors are tracking it closely to add fresh, long positions.
Technical Levels
Support Levels: $0.02500 and $0.02300
Resistance Levels:$0.02800 and $0.03000
Disclaimer
The views and opinions stated by the author or any other person named in this article are for informational purposes only and do not constitute financial, investment, or other advice. Investing in or trading crypto or stocks comes with a risk of financial loss.

Adarsh Singh is a true connoisseur of Defi and Blockchain technologies, who left his job at a “Big 4” multinational finance firm to pursue crypto and NFT trading full-time. He has a strong background in finance, with MBA from a prestigious B-school. He delves deep into these innovative fields, unraveling their intricacies. Uncovering hidden gems, be it coins, tokens or NFTs, is his expertise. NFTs drive deep interest for him, and his creative analysis of NFTs opens up engaging narratives. He strives to bring decentralized digital assets accessible to the masses.


