
 Home
Home News
News
- 1 BONK price analysis indicates the consolidation of price in a tight zone of $0.000017945 to $0.0000095105.
- 2 The Bonk price is struggling to trade above the key moving averages.
- 3 Bulls and Bears both need a proper grasp on the price.
BONK Price Stuck in a Narrow Range for a Long Time, Showing Consolidation on the Daily Charts. The price is trading between $0.000017945 and $0.0000095105 and not giving clear signals.
Indecision structural patterns show that the buyers and sellers are uncertain about the trend direction, and both exert equal pressure.

The structural pattern demonstrates the crypto price consolidation phase as both bulls and bears are fighting over the price.
However, both are failing in their attempts. At the time of writing, BONK’s price is trading at $0.0000120530 with a drop of approximately 2.15% of its market cap, and the 24-hour volume is 109.21 Million.
According to the Coingecko data, the highest price reached by the Bonk is $0.00003416, which happened in DEC 2023, approximately 2 months ago. The price is low by 64.73%, lower than the all-time high.
Furthermore, the all-time low price of Bonk is $0.078614, which was noticed on JAN 14, 2022, and the price is up by approx 13.885.95%, indicating remarkable growth.
BONK Price Analysis on the One-Day Timeframe
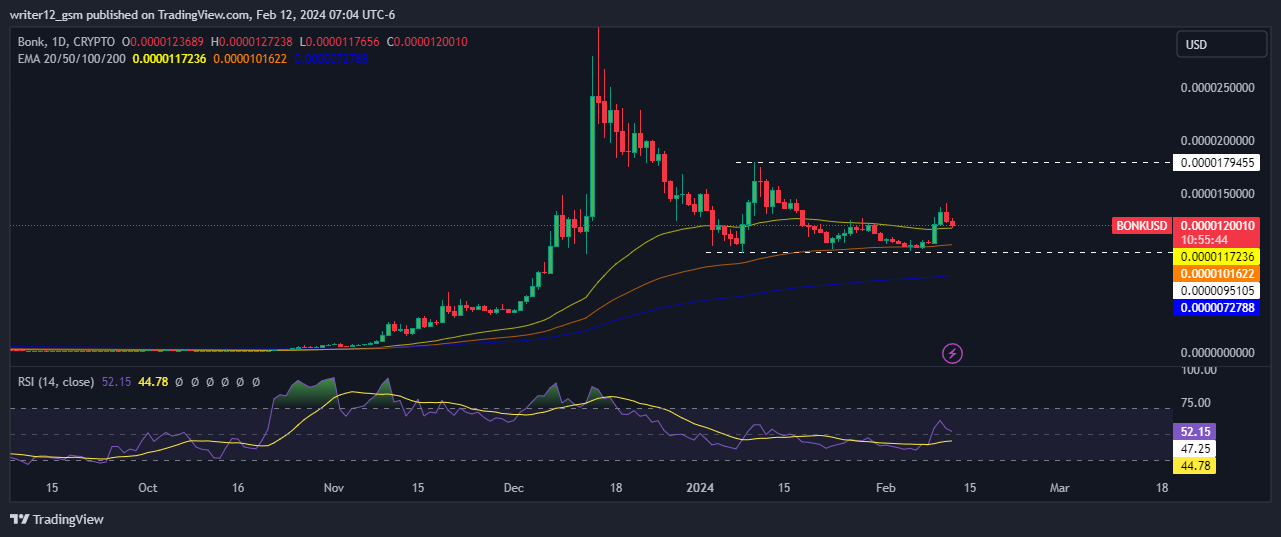
To break the consolidation phase’s upper limit, the BONK cryptocurrency’s price must start to surge. However, for the BONK cryptocurrency to enter the recovery phase, it must gather buyers. Moreover, the price of BONK crypto has broken above the 20-day, 50-day, 100-day, and 200-day moving averages in recent times.
Also, the BONK cryptocurrency needs buyers to surge high and sustain above the key moving averages.
MACD shows the consolidation phase of the price of BONK cryptocurrency. The MACD line is above the signal line and waits for any type of crossover. BONK cryptocurrency investors should wait for a change in direction on the daily chart.
Technical indicators show a consolidation phase in the price of the BONK cryptocurrency. The Relative Strength Index (RSI) shows the sideways momentum of the BONK cryptocurrency. The RSI was at 52 and moving close to the median line.
Summary
On the daily chart, the price of the BONK cryptocurrency was consolidating between a horizontal price range of $0.000017945 to $0.0000095105. per cryptocurrency. However, BONK cryptocurrency needs to accumulate buyers to speed up the recovery phase.
Technical indicators show a period of price consolidation for the Bonk cryptocurrency. BONK cryptocurrency investors should monitor directional changes on the daily charts. However, investors and traders must wait to prepare properly for the next step and avoid FOMO.
Technical Levels
Support Level: The most immediate support level for the BONK crypto price is $0.0000095105.
Resistance level: The most immediate resistance level for the Bonk crypto price is $0.0000179455.
Disclaimer
This article is for informational purposes only and provides no financial, investment, or other advice. The author or any people mentioned in this article are not responsible for any financial loss that may occur from investing in or trading. Please do your research before making any financial decisions.
Anurag is working as a fundamental writer for The Coin Republic since 2021. He likes to exercise his curious muscles and research deep into a topic. Though he covers various aspects of the crypto industry, he is quite passionate about the Web3, NFTs, Gaming, and Metaverse, and envisions them as the future of the (digital) economy. A reader & writer at heart, he calls himself an “average guitar player” and a fun footballer.


