
 Home
Home News
News
- 1 Cake price is trying to bounce back from its dynamic support level.
- 2 PancakeSwap price is trading close to a crucial resistance level.
- 3 PancakeSwap price prediction is bullish.
PancakeSwap price forecast demonstrates the bullishness in the recent sessions when it bounced off of its dynamic resistance levels.
CAKE is trading in the bullish influence and heading upward towards the 50 EMA. If the price breaks the 50-Day EMA, it could surge further.
PancakeSwap crypto is a decentralized exchange platform that allows users to swap, stake, and farm various crypto assets.
At the time of writing, PancakeSwap crypto was trading at $2.59566743 with an intraday drawdown of 0.05%, trading below the 50-Day EMA, indicating bearish sentiments on the charts. In addition, intraday trading volume also decreased in recent sessions. PancakeSwap crypto’s market capitalization is $604.35 Million.
Short-Time Frame Analysis For PancakeSwap Crypto
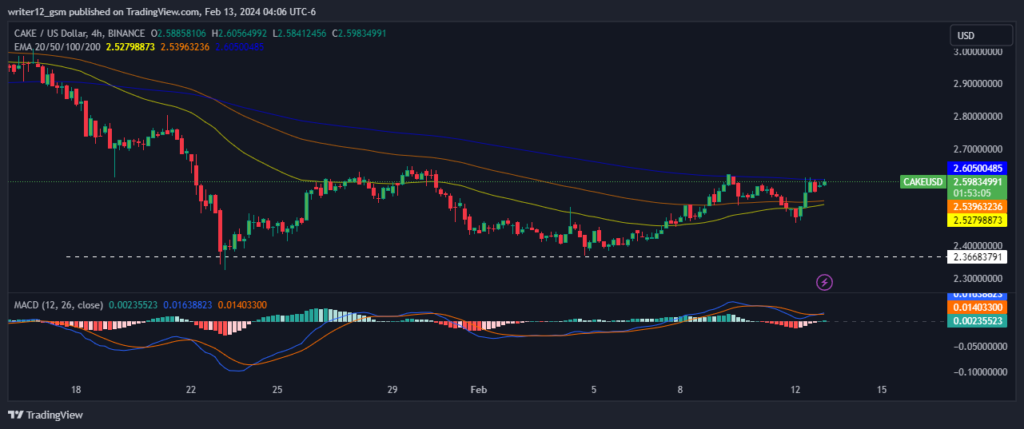
PancakeSwap crypto showed buyers strength and short-term technical charts showed mild bullishness in crypto price. Moreover, the price is trading below the 200-Day EMA, indicating further strength for the cryptocurrency.
The RSI curve is near 60, near the overbought zone, indicating bullish sentiments for the cryptocurrency. The MACD indicator started to form a green bars and a bullish crossover appeared, indicating a bullish move.
Daily-Time Frame Analysis of CAKE Crypto
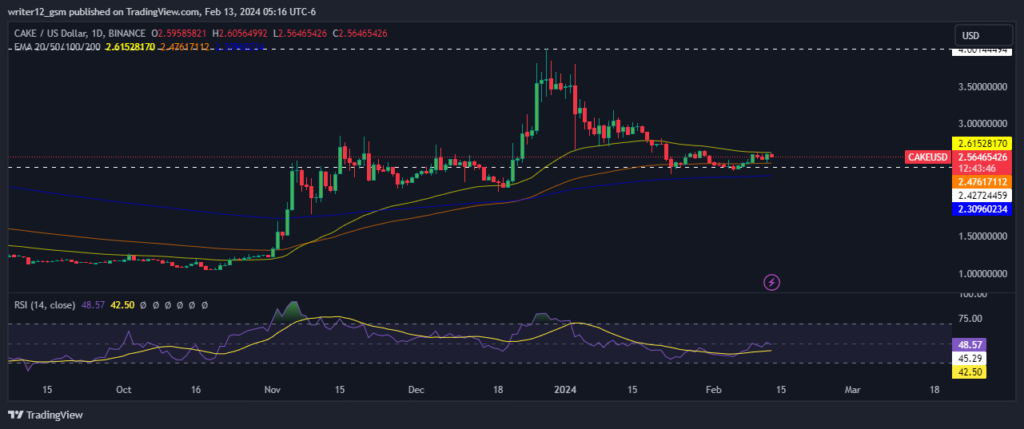
On the daily time frame the price is trading above the key moving averages but below the 50-Day EMA. The price is consolidating between the 50-Day and 100-Day EMAs and needs more buying pressure to cross these levels.
MACD is currently heading towards the positive zone with a bullish crossover and green bars on the indicator.
RSI is near 48.82, demonstrating the neutrality at the technical chart.
Weekly-Time Frame Analysis of CAKE Crypto
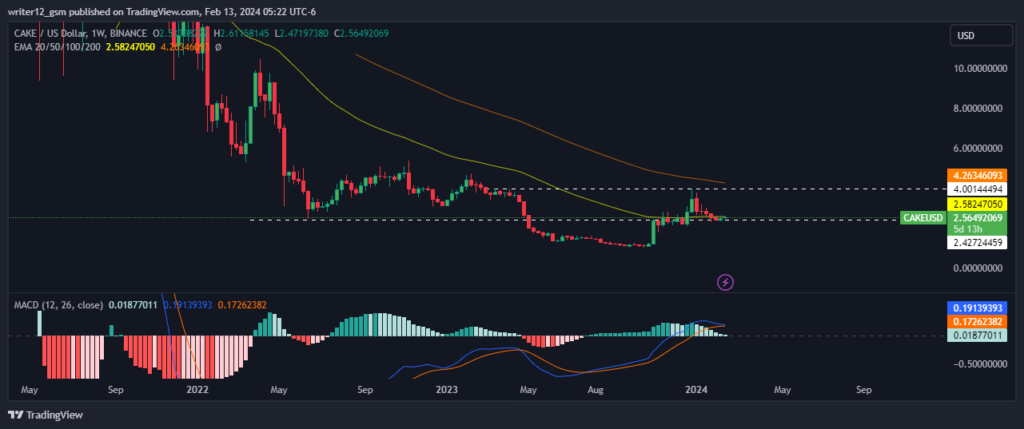
PancakeSwap crypto showed seller strength on the weekly chart. Moreover, the price is trading below major EMA levels, highlighting further weakness for the cryptocurrency.
The RSI curve is near 54, in the neutral zone, with a negative outlook indicating bearish sentiment in the cryptocurrency on the weekly time frame. The MACD indicator highlights neutrality.
Summary
The price of PancakeSwap crypto has been trading in a narrow range for a long time, showing consolidation on the daily chart. The price has bounced back from its dynamic support and broke a crucial resistance level. The technical indicators are giving mixed signals, with some bullishness on the short-term charts and some bearishness on the weekly chart.
Technical Levels
Support Levels: $2.47617639 and $2.30960499
Resistance Levels: $4.00144494 and $3.18356072
Disclaimer
This article is for informational purposes only and does not provide any financial, investment, or other advice. The author or any people mentioned in this article are not responsible for any financial loss that may occur from investing in or trading. Please do your research before making any financial decisions.

Adarsh Singh is a true connoisseur of Defi and Blockchain technologies, who left his job at a “Big 4” multinational finance firm to pursue crypto and NFT trading full-time. He has a strong background in finance, with MBA from a prestigious B-school. He delves deep into these innovative fields, unraveling their intricacies. Uncovering hidden gems, be it coins, tokens or NFTs, is his expertise. NFTs drive deep interest for him, and his creative analysis of NFTs opens up engaging narratives. He strives to bring decentralized digital assets accessible to the masses.


