
 Home
Home News
News

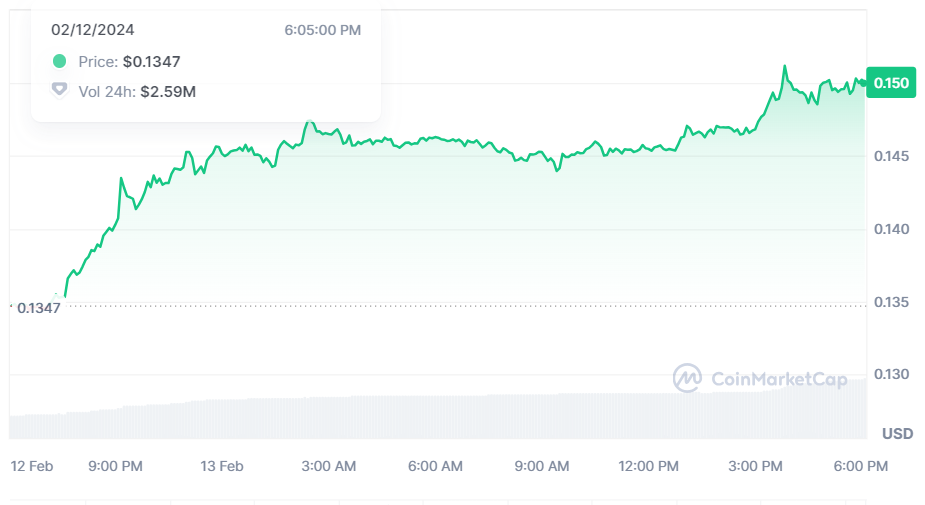
- 1 Rootstock Infrastructure Framework crypto price was at $0.153 recording an intraday gain of 5.31% at the time of writing.
- 2 The technical indicators imply a positive outlook above the 50 and 200-Day EMAs.
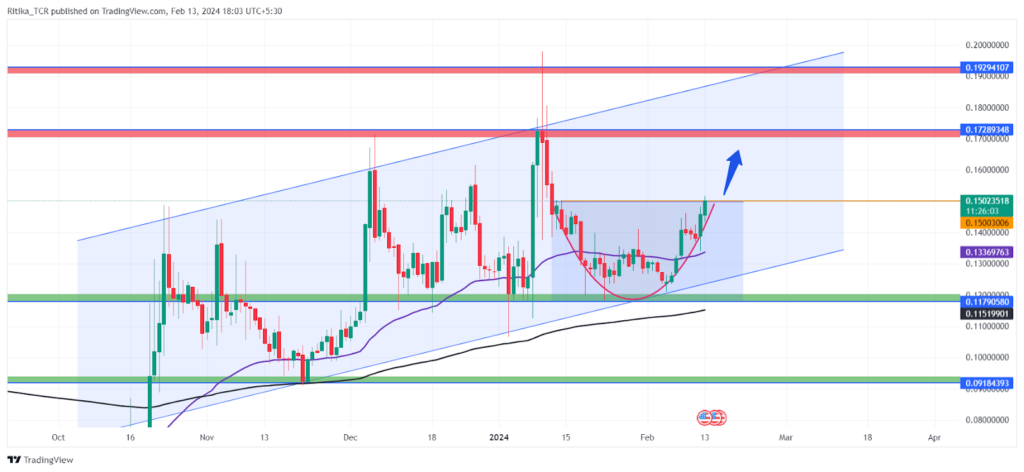
Rootstock Infrastructure Framework (RIF crypto) discovered a stellar buying interest in Tuesday’s session as the crypto broke out after forming a rounding bottom pattern. The price jumped strongly after reversing its course near the 50-Day EMA which acted as a dynamic support.
Moreover, the breakout highlights the end of a short-term correction phase. Buyers pushed the price back to the bullish territory and established their presence near the lower levels.

The long-term trend outlook is positive above the 50 and 200-Day EMAs. The crypto is headed higher, forming a bullish trajectory. The recent breakout has turned the short term trend bullish and has aligned with the long term trend. The crypto continues to rise higher forming higher highs and higher lows.
At the time of writing, the Rootstock Infrastructure Framework crypto was at $0.153 with an intraday rise of 5.31%. It has a live market capitalization of $151.9 Million and ranks 294th in the overall crypto market.
It has a total circulating supply of 1 Billion RIF tokens. The fully diluted market cap of RIF crypto is $151.601 Million.
RIF Crypto Analysis Over Daily Timeframe
Moreover, the daily chart witnesses the formation of an inclining parallel channel pattern. The crypto is headed higher respecting the lower and upper boundary of the channel pattern.
As per the inclining channel pattern, the crypto may face resistance near the upper boundary of the channel. The short term investors and traders may target the upper supply levels of $0.172 and $0.192 in the long side trades.
RIF Crypto Indicator Analysis
The technical indicators imply a bullish outlook above the 50 and 200-Day EMAs. At the time of writing, RSi was at 64.59 points and that of the SMA line was at 51.22 points. RSI line has made a bullish crossover of the SMA line indicating a positive sentiment in the crypto.
RIF Price Prediction February 2024
The most optimistic view of analysts estimates that the RIF crypto may attain a high of $0.177 by the end of February 2024. However, the pessimistic aspect of analysts suggests that the price could drop lower near the $0.11 level after the breakdown of 50-Day EMA.
RIF Crypto Price Prediction 2024
The price forecast for the year 2024 is that the RIF token price could reach a high of $0.266, suggesting a potential gain of over 77.10% if the most positive conditions prevail. Moreover, the bearish outlook of the analysts pegs the price at $0.209 by the year-end.
RIF Price Prediction 2025
By the year 2025, the Rootstock Infrastructure Framework price may attain a high of $0.410 as the highest price on the positive side. On the flip side, the minimum price up to which the crypto price may rise by the year 2025 is $0.285.
Disclaimer
The views and opinions stated by the author, or any people named in this article, are for informational purposes only and do not establish financial, investment, or other advice. Investing in or trading crypto or stock comes with a risk of financial loss.

Steefan George is a crypto and blockchain enthusiast, with a remarkable grasp on market and technology. Having a graduate degree in computer science and an MBA in BFSI, he is an excellent technology writer at The Coin Republic. He is passionate about getting a billion of the human population onto Web3. His principle is to write like “explaining to a 6-year old”, so that a layman can learn the potential of, and get benefitted from this revolutionary technology.


