
 Home
Home News
News
- 1 The KAVA token glimpsed distribution from the highs and has slipped below the neutral region.
- 2 Bears have persisted in showing their strength and continued in declining gains.
The KAVA token price signifies slippages from the top and is close to the make-or-break region of $0.700. Amidst the market reversal, the KAVA token could not manage to attain pullback and has hovered in the bearish zone, delivering the bears’ dominance. The price action conveys low investor interest and is hovering in a range below the 20-day EMA mark.
The KAVA price slipped below the significant moving averages and is delivering a downtrend on the charts. The token persisted in forming the lower low swings and is glimpsing selling pressure for the past sessions. Additionally, the buyers did not attain a pullback and continued attempting to escape the 20-day EMA to initiate a pullback.
The KAVA token price was $0.7333 at press time, with an intraday drop of 0.40%, showing neutrality on the charts. Moreover, the trading volume increased by 2.23% to $25.39 Million, highlighting the profit booking. The pair of KAVA/BTC is at 0.0000144 BTC, and the market cap is $51.49 Million. Analysts are bearish and suggest that the KAVA price will continue to drag the gains and may retest the
support zone of $0.500 soon.
KAVA on Daily Charts Displays Rounding Top Formation
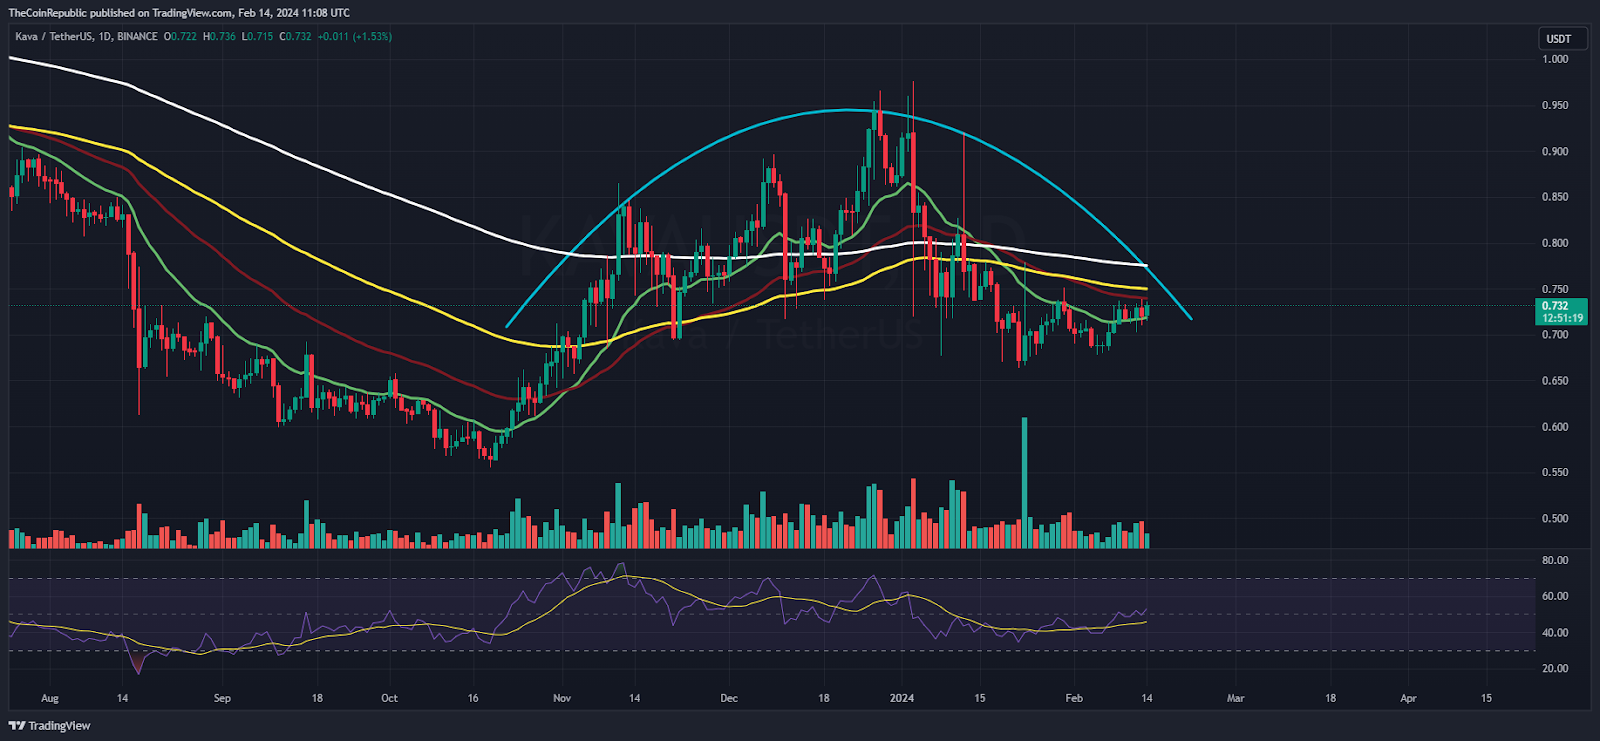
The token declined from the highs on the daily charts and lost over 20% in the recent sessions. Furthermore, the token has flipped to the bearish region, which trapped the bulls and is in trouble now. Moreover, the sellers now have an edge and persist in pushing the token toward its demand zone. However, the token has paused the decline and is hovering near its critical support level of $0.700.
The Relative Strength Index (RSI) curve stayed close to the midline and showed a negative divergence, implying selling pressure for the past sessions. Moreover, the MACD indicator shows a bearish crossover, and forming red bars on the histogram suggests an underperformance for the following sessions.
KAVA on Weekly Charts Reveals Rejection from the 50-Day EMA
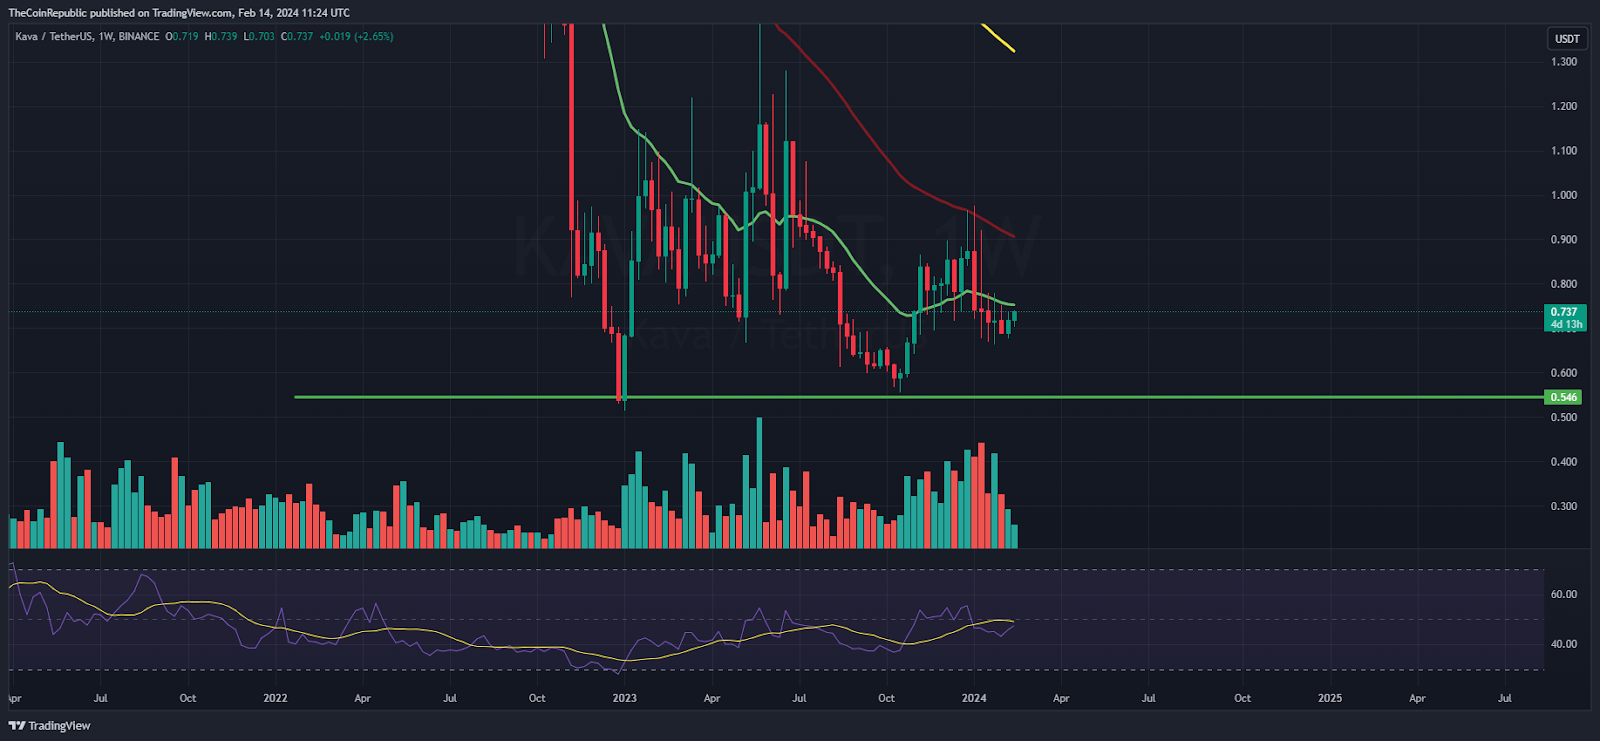
On the weekly charts, the KAVA price faced a sharp rejection from the 50-day EMA and reverted gains toward the bearish region, signifying sellers’ grip there. Moreover, the bear cartel looks aggressive and successfully forces the token below the 20-day EMA to initiate a fall. Per the Fib retracement levels, the token is close to the 23.6% zone and may soon stretch the downside toward $0.500.
Summary
The KAVA price was hovering below the key moving averages and is replicating distribution from the highs, revealing selling pressure for the past sessions. Furthermore, despite the positive market sentiment, the token did not attain a pullback, which signifies low investor interest.
Technical Levels
Support Levels: $0.7200 and $0.700
Resistance Levels:$0.7500 and $0.800
Disclaimer
The views and opinions stated by the author or any other person named in this article are for informational purposes only and do not constitute financial, investment, or other advice. Investing in or trading crypto or stocks comes with a risk of financial loss.

Andrew is a blockchain developer who developed his interest in cryptocurrencies while pursuing his post-graduation major in blockchain development. He is a keen observer of details and shares his passion for writing, along with coding. His backend knowledge about blockchain helps him give a unique perspective to his writing skills, and a reliable craft at explaining the concepts such as blockchain programming, languages and token minting. He also frequently shares technical details and performance indicators of ICOs and IDOs.


