
 Home
Home News
News
- 1 Stacks crypto price is currently trading at $2.1518 with a rise of 1.45% in the last 24 hours and a market cap of $3.08 Million.
- 2 Stacks crypto price recorded a phenomenal 42.41% increase over the past seven days.
- 3 STXUSD broke its recent high and reached the level of $2.1663.
Stacks (STXUSD) analysis highlights the bullish momentum in the crypto price on the daily chart. The price has broken its recent high and is heading upwards, making higher highs.
Stacks price rose continuously for the past year, gaining 635.19%. STX crypto chart shows buyers have been increasing pressure after the pullback.
If it can stay at this level, the Stacks price could continue to go up and reach the first and second targets of $3.00 and $4.00 respectively, otherwise, it might hit the closest support levels of $1.500 and $1.339.
At press time, the Stacks crypto price was $2.1518, with an intraday gain of 1.45%, highlighting bullishness on the daily technical chart. Moreover, the trading volume is 364.79 Million. The market cap is $3.08 Billion. Moreover, indicators suggest a bullish view for the upcoming trading sessions.
Stacks crypto has experienced a phenomenal increase of 42.41%, and this incline has been steeper over a month, reaching around 35.74%. In the past 3 months, STX crypto dropped by about 226.44%, while the incline extends to around 360.42% over the last six months. Nevertheless, the crypto’s performance throughout the year has been outstanding, with a year-to-date gain of 42.62%.
Technical Analysis of Stacks Crypto Price in 1-D Timeframe
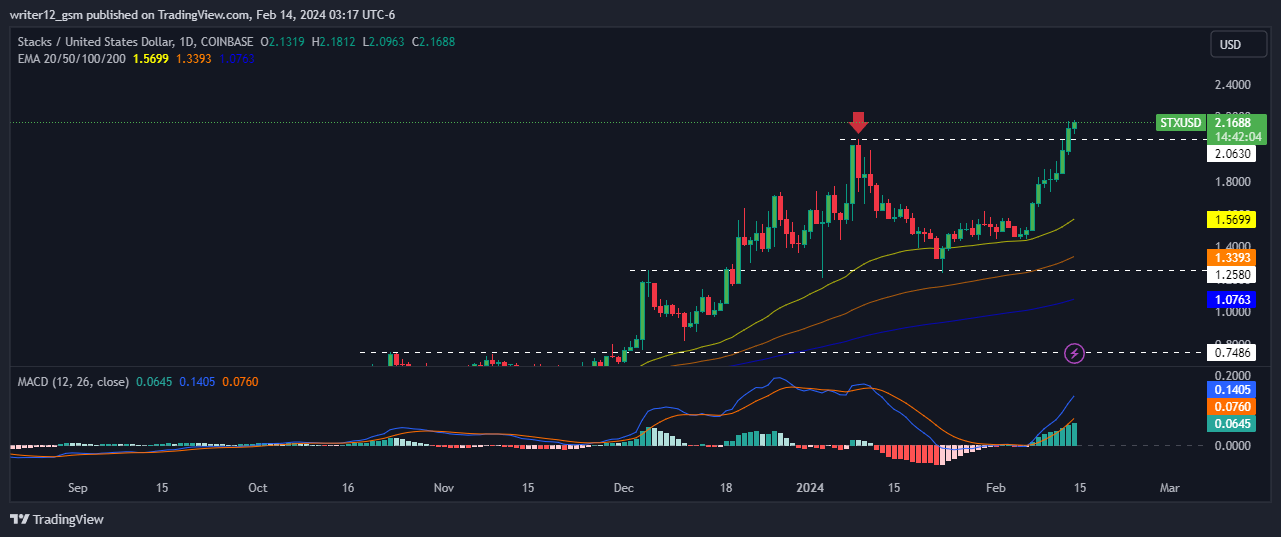
At the time of publishing, Stacks crypto (USD: STX) is trading above the 50 and 200-Day SMAs (Simple moving averages), which are supporting the price trend.
The current value of RSI is 79.20 points. The 14 SMA is above the median line at 61.07 points which indicates that the Stacks crypto is extremely bullish.
The MACD line at 0.1431 and the signal line at 0.0766 are far beyond the zero line. A bullish crossover is noticed in the MACD indicator which signals more strength for the STX crypto price.
Summary
Stacks (USD: STX) technical oscillators highlighting a bullish trend. The MACD, RSI, and EMAs are giving strong signals and suggest that the bullish trend could be long-term. Furthermore, Stacks crypto may break its all-time high in the upcoming sessions.
Technical Levels
Support Levels: $1.5728 and $1.3408
Resistance Levels: $3.00 and $4.00
Disclaimer
This article is for informational purposes only and does not provide any financial, investment, or other advice. The author or any people mentioned in this article are not responsible for any financial loss that may occur from investing in or trading. Please do your own research before making any financial decisions.

Amanda Shinoy is one of the few women in the space invested knee-deep in crypto. An advocate for increasing the presence of women in crypto, she is known for her accurate technical analysis and price prediction of cryptocurrencies. Readers are often waiting for her opinion about the next rally. She is a finance expert with an MBA in finance. Quitting a corporate job at a leading financial institution, she now engages herself full-time into financial education for the general public.


