
 Home
Home News
News

- 1 The token has regained strength and is displaying a rebound.
- 2 Bulls have gained traction and a bullish crossover was glimpsed.
The 1INCH token price signifies a pullback from the 200-day EMA and shows a rebound in the last sessions. Furthermore, the price action reveals buying momentum, and the token has retested the prompt hurdle of $0.4500, which is the make-or-break zone. However, the bulls must cross the zone and sustain above it for a significant upside toward $0.5000 in the following sessions. On the contrary, the token may drag toward $0.4200 if rejection happens.
1INCH price climbed above the significant moving averages and delivered higher high swings in the last sessions. Moreover, the price action gave investor interest and surpassed the trajectory neckline of $0.4200 the previous week. Per the Fib levels, the token has escaped the 38.2% zone and is readying to reach the 50% zone beyond $0.4700.

The 1INCH token (1INCH) price was $0.4519 at press time, with an intraday gain of 1.71%, showing neutrality on the charts. Moreover, the trading volume increased by 5.17% to $62.10 Million, highlighting the pullback. The pair of 1INCH/BTC is at 0.00000866 BTC, and the market cap is $516.73 Million. Analysts are neutral and suggest that the 1INCH price will face volatility and may retest the round mark of $0.5000 soon.
1INCH On Daily Charts Displays Rebound From 100 Day EMA
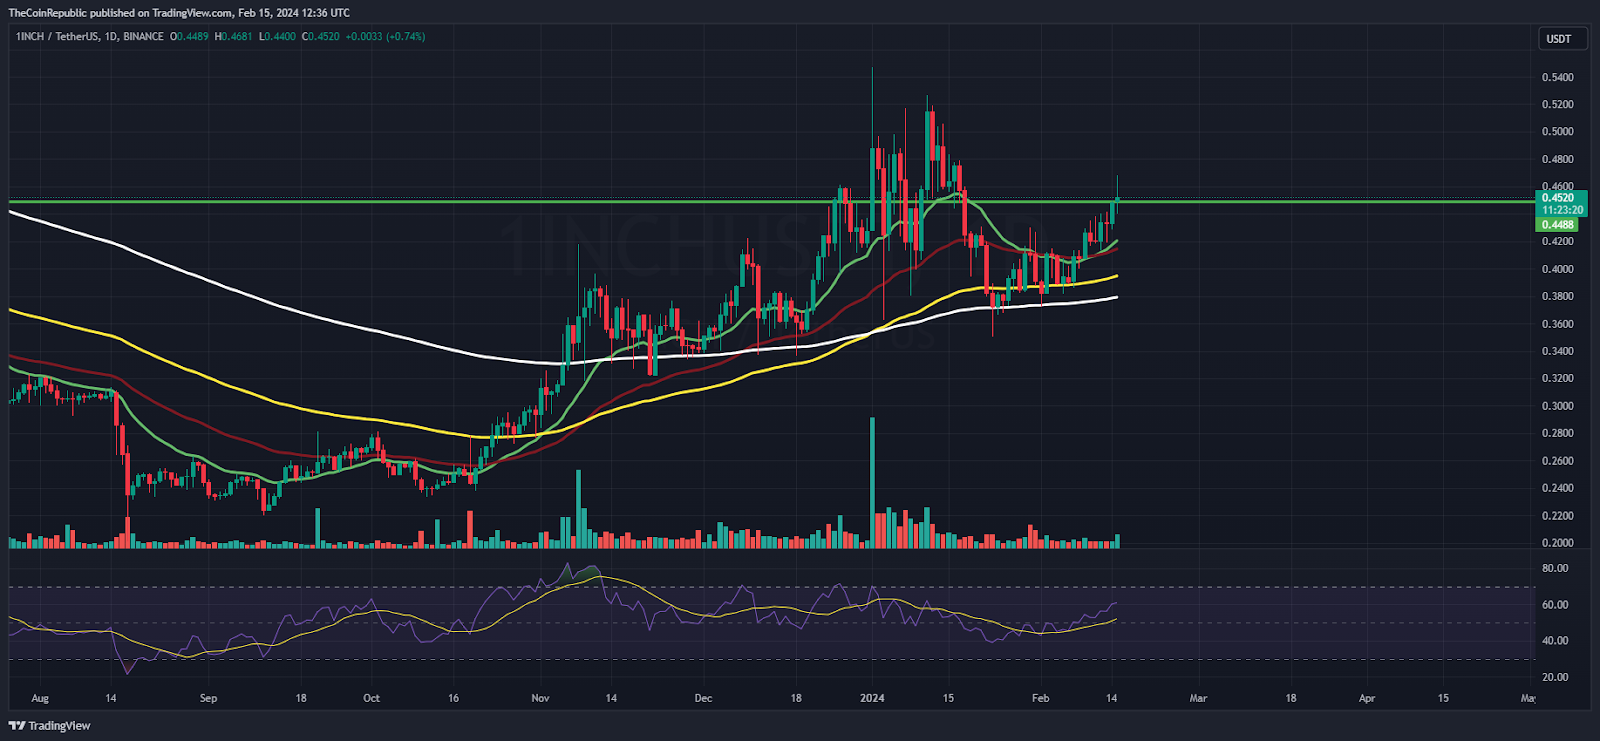
On the daily charts, the 1INCH price signifies neutrality and shows a pullback. Moreover, the token has attained strength and aims to reach the round mark of $0.5000 to acquire bullishness. Furthermore, the trend is intact, and bulls need to lift the token above $0.4800, which might trap sellers and further shorten the covering move trigger.
The Relative Strength Index (RSI) curve stays in the overbought zone, forming a positive divergence on the charts. Furthermore, the MACD indicator shows a bullish crossover and green bars on the histogram, suggesting a bounce continuation in the following sessions.
1INCH On Weekly Charts Exhibits a Reversal From Lows
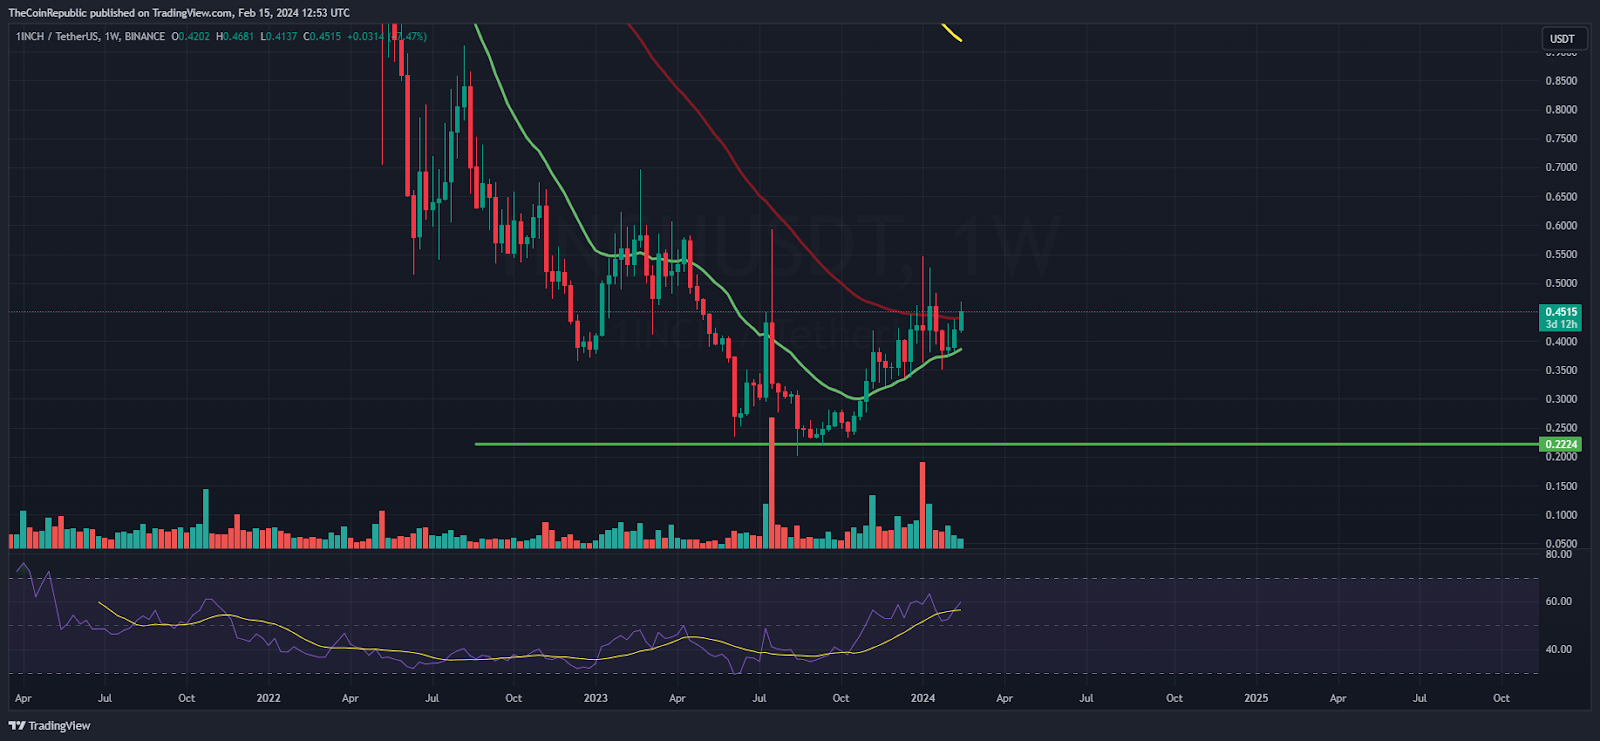
The token price replicates a reversal from its all-time low (ATL) mark of $0.2000 on the weekly charts. Afterward, buyers’ accumulation was witnessed, and the token recuperated over 110% in the last sessions. Additionally, the token registered a trend reversal and noted a falling channel breakout. To stretch the reversal, buyers must sustain gains above the 50-day EMA mark near $0.4550.
Summary
The 1INCH token price noted a recovery and is trying to cross the immediate hurdle of $0.4500 to extend the gains. The token managed a rebound from the 200-day EMA amid the market surge, and buying momentum was witnessed.
Technical Levels
Support Levels: $0.4300 and $0.4100
Resistance Levels:$0.4600 and $0.4800
Disclaimer
The views and opinions stated by the author or any other person named in this article are for informational purposes only and do not constitute financial, investment, or other advice. Investing in or trading crypto or stocks comes with a risk of financial loss.

Andrew is a blockchain developer who developed his interest in cryptocurrencies while pursuing his post-graduation major in blockchain development. He is a keen observer of details and shares his passion for writing, along with coding. His backend knowledge about blockchain helps him give a unique perspective to his writing skills, and a reliable craft at explaining the concepts such as blockchain programming, languages and token minting. He also frequently shares technical details and performance indicators of ICOs and IDOs.


