
 Home
Home News
News

- The LTC coin has faced selling pressure this week amidst the bull market.
- Litecoin’s price managed to sustain gains on the trendline support of $68.
The Litecoin price noticed a hurried selloff from the 200-day EMA mark and caused panic among investors. As per the media reports, a Litecoin whale has transferred over 100,000 LTC coins to the prominent crypto exchange Binance, which led to a decline in the yesterday market session. However, the follow-on selling could not shed the LTC price and a smart comeback was noted from the trendline support zone of $68.

The Litecoin price is trading close to its 100-day EMA mark and the round mark of $70, showing neutrality on the charts. However, the technicals did not showcase any positive signs and are displaying lower highs and lower low swings. The recent inflows may trigger further decline and is a negative sign for the LTC crypto in the short term.

For the past few sessions, the Litecoin price was hovering in a range and did not reflect any significant move amid the market surge.
The Litecoin (LTC) price was $70.02 at press time with an intraday gain of 1.22%, showing neutrality on the charts. Moreover, the trading volume increased by 8.76% to $481.43 Million, highlighting the pullback. The pair of LTC/BTC is at 0.00135 BTC, and the market cap is $5.17 Billion. Analysts are neutral and suggest that the LTC price will face volatility and retest the round mark of $50 soon.
LTC Price on Daily Charts Displays Symmetrical Triangle Formation
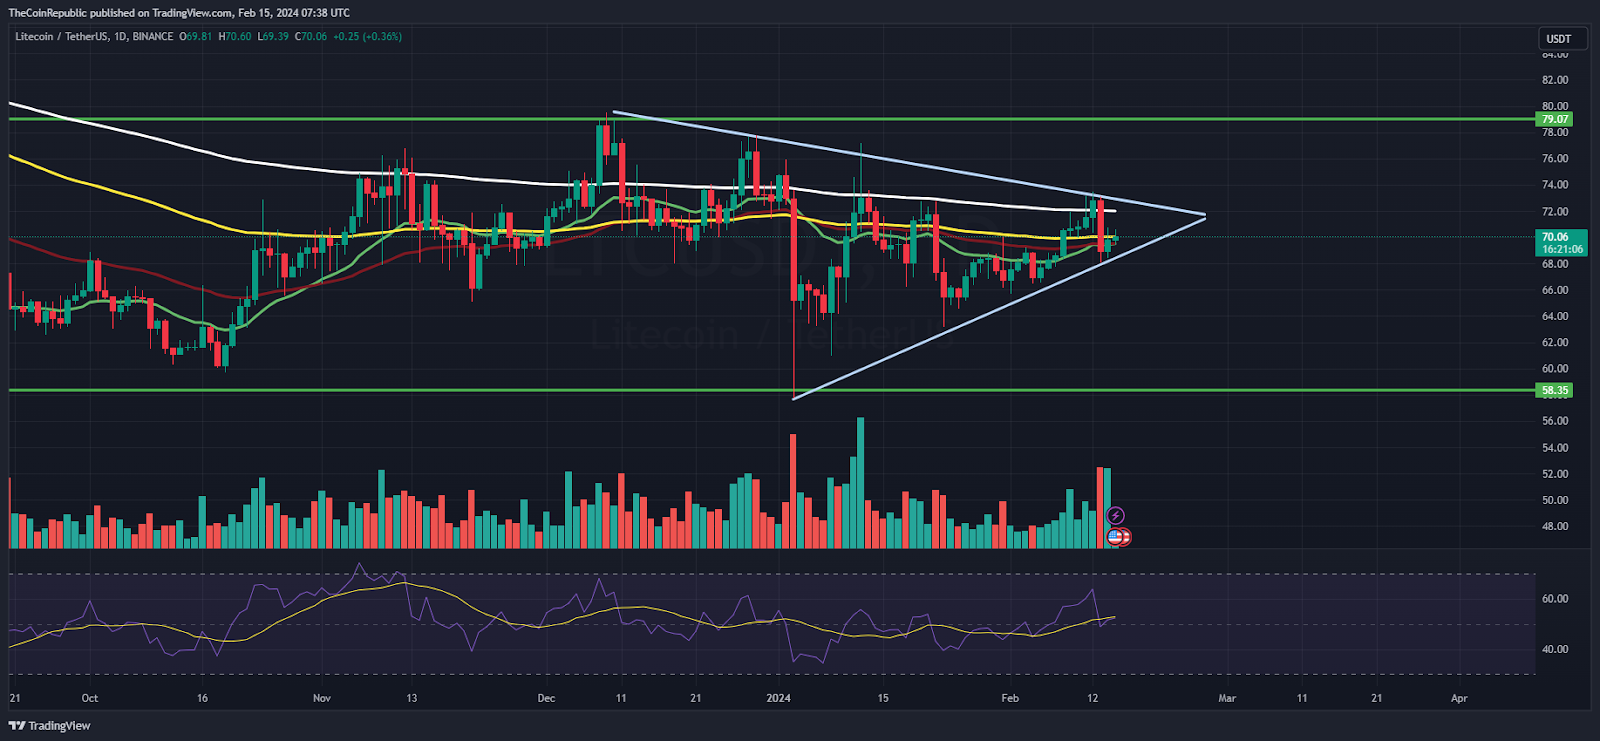
On the daily charts, the Litecoin price persisted in facing rejection from the 200-day EMA and failed to escape it despite multiple attempts by the mighty bulls. However, the uncertain moves made investors cautious and covered their positions, leading to a price decline of over 10% in the past weeks. A symmetrical triangle formation was noted, and the price is close to registering a move.
The Relative Strength Index (RSI) curve stays near 55, implying neutral stances and forming a positive crossover. Moreover, the MACD indicator shows a bullish crossover and displays buying interest in the intraday session. Per the Fib zone, the LTC price was near 38.2% and is trying to bounce toward the 50% zone above $78.
LTC Price on Weekly Charts Exhibits Rejection from the 50-Day EMA
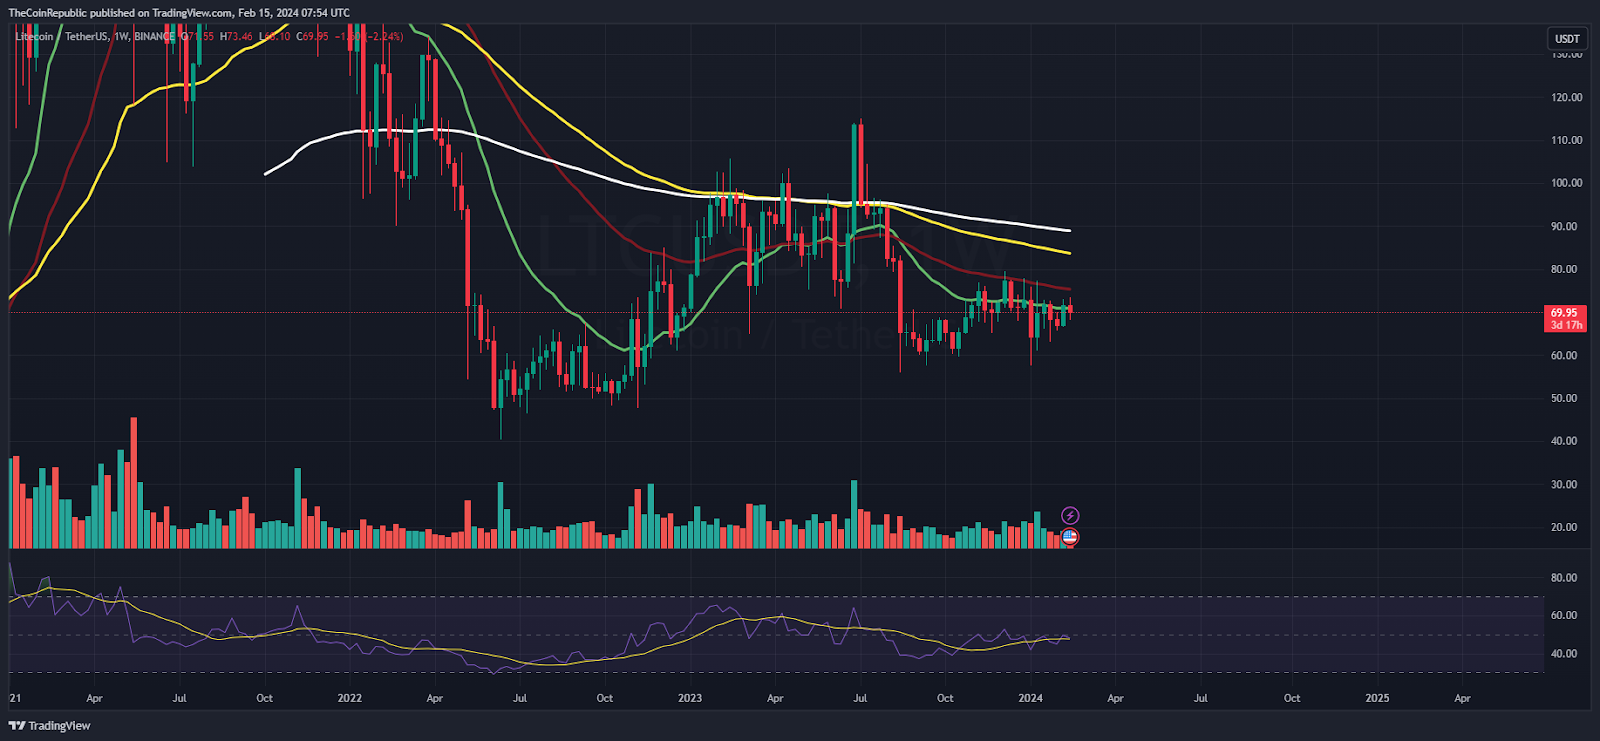
On the weekly charts, the Litecoin price continued to face rejection. It is trading below the 50-day EMA, replicating sellers’ strength in the past sessions. Moreover, the price action conveys range-bound moves and signals a dilemma among investors for the upcoming movements.
Summary
The Litecoin (LTC) price signifies a negative outlook and may persist in hovering below $80 for the upcoming sessions. Moreover, the coin is readying for a significant move and is close to the trendline breakout. If it exceeds the $75 mark, it may reach $80. Suppose it slips below $65, it may reach $50.
Technical Levels
Support Levels: $65 and $60
Resistance Levels:$75 and $80
Disclaimer
The views and opinions stated by the author or any other person named in this article are for informational purposes only and do not constitute financial, investment, or other advice. Investing in or trading crypto or stocks comes with a risk of financial loss.

Nancy J. Allen is a crypto enthusiast, with a major in macroeconomics and minor in business statistics. She believes that cryptocurrencies inspire people to be their own banks, and step aside from traditional monetary exchange systems. She is also intrigued by blockchain technology and its functioning. She frequently researches, and posts content on the top altcoins, their theoretical working principles and technical price predictions.


