
 Home
Home News
News
- 1 SUI crypto price has shown remarkable growth of almost 21% in the last seven days showcasing bullishness.
- 2 SUI crypto price is currently trading at $1.8666 with a drop of 2.17% in the last 24 hours with a market cap of $2.18 Million.
- 3 The crypto price is far beyond the key moving averages showcasing the bullish pressure in trhe daily technical chart.
SUI crypto price analysis demonstrates the extreme bullishness on the daily technical chart showing the bulls are highly active in the crypto.
Bulls are exerting pressure and sideline the bears on the daily timeframe chart. The price is heading in the upward direction by making a higher high structure.
The exponential moving averages (EMAs) are trading below the price showcasing that the trend is in the favour of the buyers and the price might take more new highs in the upcoming days.
SUI crypto gave a spectacular return throughout the year. Year to date the SUI gave a return of 141.19% and in the last 6 months, it gave a remarkable return of 286.23%.
Additionally, the price showed an outstanding surge in recent days as the price has grown by almost 230% in the last months and the price is up by 36% in the last 340 days. Last week it grew by almost 21% showing an outstanding performance and the presence of the bulls is solid in the price.
Presently, the SUI crypto price was $1.8666, with an intraday loss of 2.17%, showing mild bearishness on the charts. Moreover, the 24 trading volume is 479.49 Million. The market cap is $2.18 Billion.
As per the technical summary on TradingView, out of 26 indicators, 4 are on the sell side, 8 are on the neutral side and 14 are on the buy side. The technicals are demonstrating extreme bullishness on the daily technical chart.
Technical Analysis of SUI Crypto Price on Daily Technical Chart
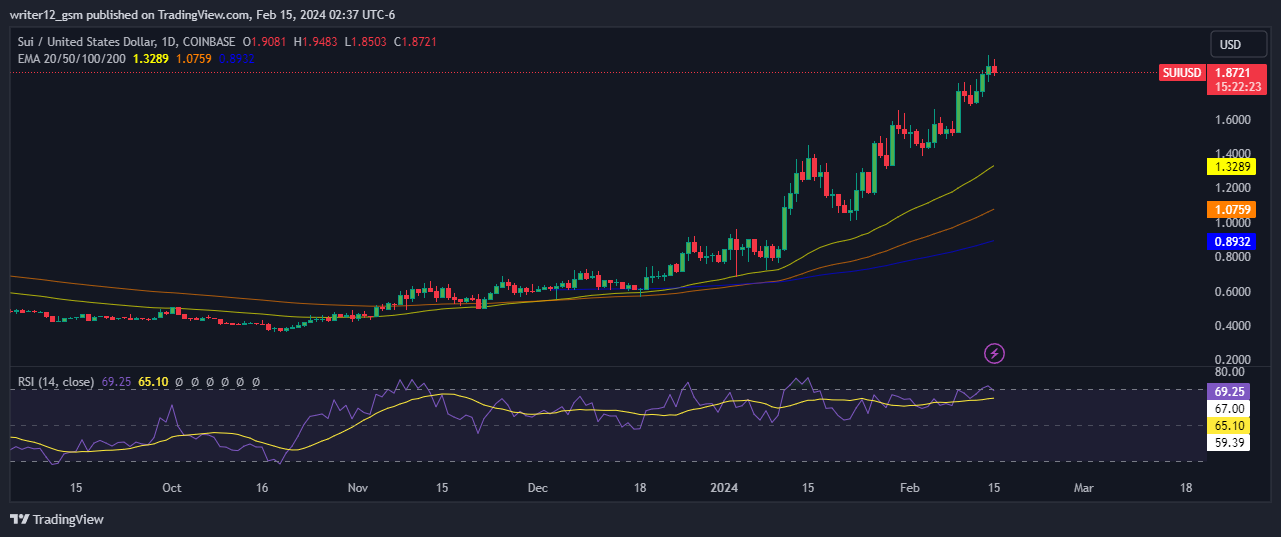
At the time of writing, SUI crypto (USD: SUI) was trading beyond the 50 and 200-Day EMAs (exponential moving averages).
The RSI is following a bullish momentum and is showcasing strong bullish momentum in the crypto price. Following this, the RSI has broken above the 14-Day SMA and the RSI is trading at a level of 69.02.
SUI crypto price is close to the upper Bollinger band and above the median line. The following behavior of the indicator shows a solid uptrend in the crypto price and also the possibility of reaching new highs in upcoming sessions.
The supertrend indicator further follows a bullish momentum and on the daily charts, the Supertrend indicator gave a buy signal on the daily technical chart. Since then, the price of crypto has consistently advanced to higher levels.
Summary
SUI (USD: SUI) technical oscillators and indicators support the bullish trend. The MACD, RSI, and EMAs are positive indications and suggest that the bullish trend may continue in the SUI crypto price.
Technical Levels
Support Levels: $1.5996 and $1.2748
Resistance Levels: $2.00 and $2.50
Disclaimer
This article is for informational purposes only and does not provide any financial, investment, or other advice. The author or any people mentioned in this article are not responsible for any financial loss that may occur from investing in or trading. Please do your own research before making any financial decisions.
Anurag is working as a fundamental writer for The Coin Republic since 2021. He likes to exercise his curious muscles and research deep into a topic. Though he covers various aspects of the crypto industry, he is quite passionate about the Web3, NFTs, Gaming, and Metaverse, and envisions them as the future of the (digital) economy. A reader & writer at heart, he calls himself an “average guitar player” and a fun footballer.


