
 Home
Home News
News

- 1 The APT token price shows a sharp rise, displaying bulls’ dominance.
- 2 Buyers have gained momentum and are looking to reach $12.
The APT price replicates the bullish momentum, and a spike of over 8% in the intraday session was noted. Furthermore, a symmetrical triangle pattern breakout above the trendline of $9.20 was recorded, and a fresh buying momentum was reflected on the charts. The token delivers cues that buyers have gained strength and are willing to lift the token above the $12 mark.
The APT token price has climbed above the key moving averages and is displaying a trendline breakout, which boosts the buying momentum. Aptos token’s price action reflects the fresh prolonged buildup activity, and sellers looked trapped. Followed by the market surge, the token portrayed a bullish outlook and delivered a significant up move. Per the Fib levels, the token has halted gains above the 38.2% zone and is trying to exceed the 50% zone above the $12 mark.

The Aptos token (APT) price was $10.40 at press time, with a massive intraday gain of 13.22%, showing bullishness on the charts. Moreover, the trading volume increased by 73.16% to $334.04 Million, highlighting the pullback. The pair of APT/BTC is at 0.000195 BTC, and the market cap is $1.32 Billion. Analysts are bullish and suggest that the APT price will continue to extend gains and may reach $12 soon.
APT on Daily Charts Displays a Breakout
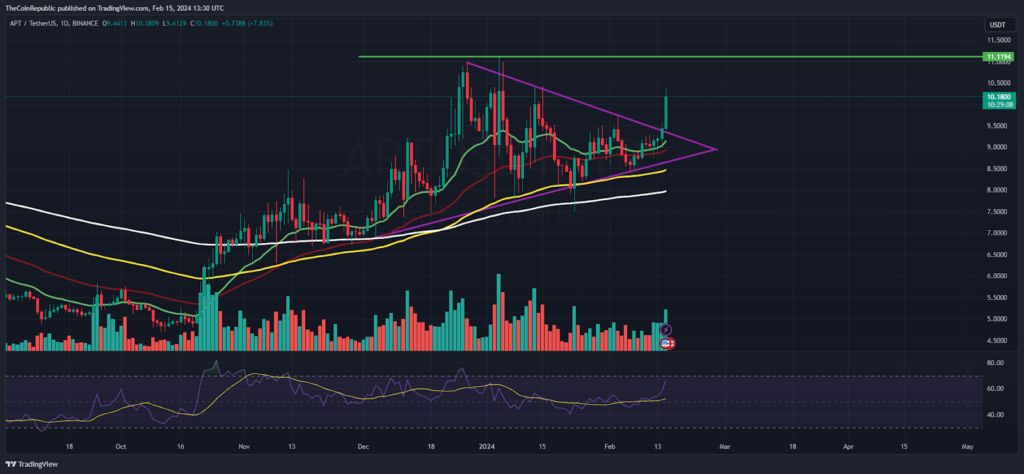
On the daily charts, Aptos crypto is trading in an uptrend, reflecting a sharp move that trapped sellers. The token obtained a sharp bounce from the 20-day EMA mark and is keen to stretch the move toward $11. Furthermore, the price action noted the follow-on buying momentum and implied a rise in trading volume, which signals investor interest.
The Relative Strength Index (RSI) curve rose to the overbought zone and formed a positive divergence, signifying the bullish outlook. Similarly, the MACD indicator shows a bullish crossover and suggests a further up move for the upcoming sessions.
APT on Weekly Charts Exhibits Recovery from Demand Zone
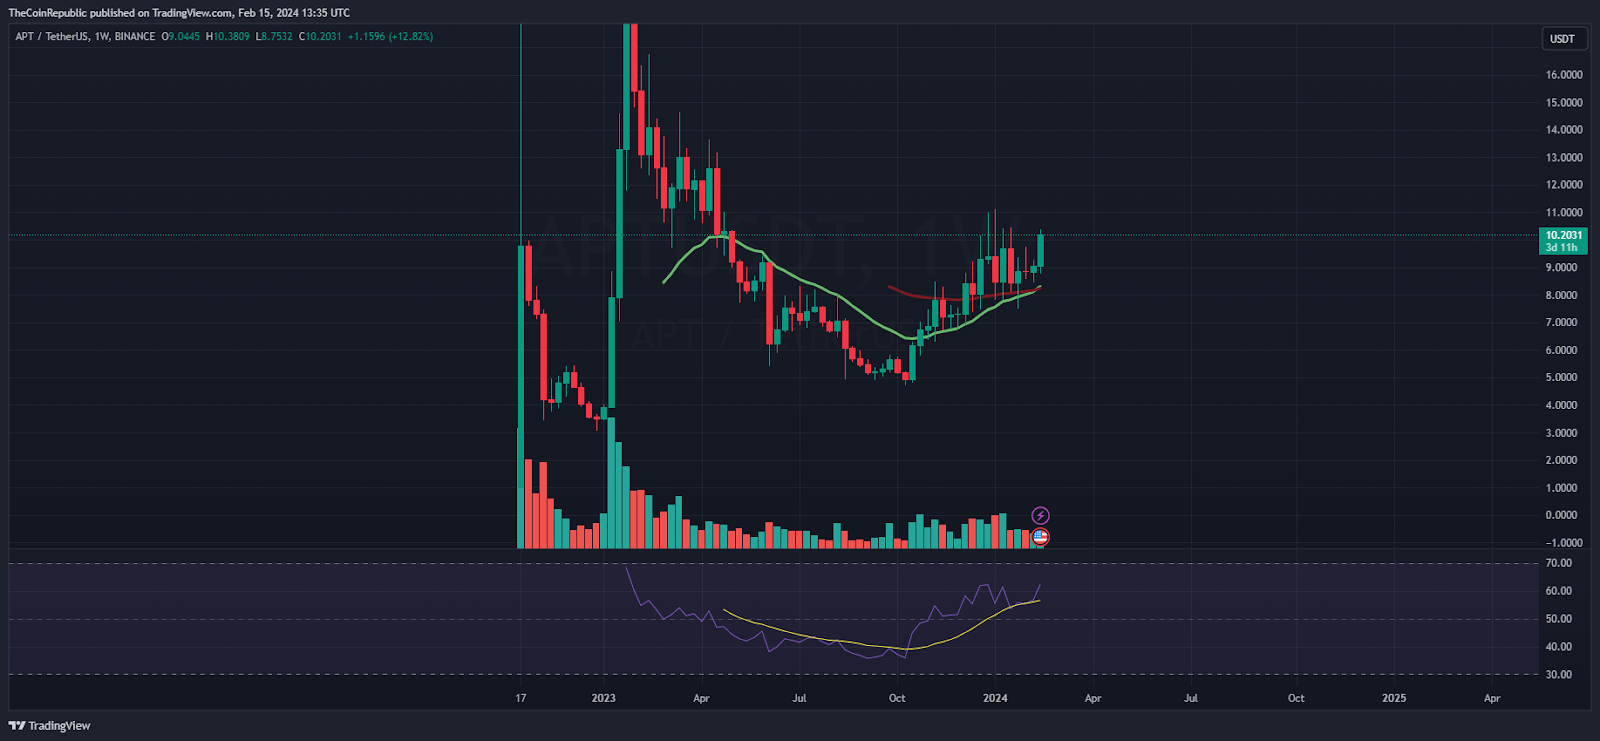
On the weekly charts, APT price has ended the correction and noted a recovery inside the rising parallel channel from the bottom of $5. Afterward, the token healed over 100% and regained strength in the last sessions. Buyers are keen to lift the token above $12 to retain the blue sky zone in the bullish territory.
Summary
Aptos (APT) token price has reflected a breakout and noted a substantial bullish marubozu candlestick displayed sharp buying activity. Moreover, the token has escaped the 20-day EMA mark and witnessed a bullish crossover, which exhibits the pullback. Additionally, the token has escaped the $10 mark and is suggesting a rise toward $12 for the upcoming sessions.
Technical Levels
Support Levels: $10 and $9.80
Resistance Levels:$11 and $11.60
Disclaimer
The views and opinions stated by the author or any other person named in this article are for informational purposes only and do not constitute financial, investment, or other advice. Investing in or trading crypto or stocks comes with a risk of financial loss.

Amanda Shinoy is one of the few women in the space invested knee-deep in crypto. An advocate for increasing the presence of women in crypto, she is known for her accurate technical analysis and price prediction of cryptocurrencies. Readers are often waiting for her opinion about the next rally. She is a finance expert with an MBA in finance. Quitting a corporate job at a leading financial institution, she now engages herself full-time into financial education for the general public.


