
 Home
Home News
News
- 1 BLUR token registered a pullback and is likely to exceed $0.8000.
- 2 Buyers have gained momentum and are dominating.
BLUR token noted a symmetrical triangle pattern breakout and is heading to escape the round mark of $0.8000. The price action signifies follow-on buying momentum and reflects bullish dominance.
BLUR price climbed above the key moving averages and has retained the bullish territory. Moreover, the price action shows higher high swings which means buyers have gained momentum to hit the $0.8000 mark. Beyond that, the token may carry forward the rally toward $0.8600 followed by $0.9000 in the upcoming sessions.
The Blur token (BLUR) price was $0.7338 at press time, with an intraday drop of 2.77%, reflecting profit booking on the charts. Moreover, the trading volume increased by 15.20% to $151.66 Million. The pair of BLUR/BTC is at 0.0000140 BTC, and the market cap is $954.11 Million. Analysts are neutral and suggest that the BLUR price will face volatility and may surpass $0.7900 in the next sessions.
BLUR On Daily Chart Displays Rebound From 20-Day EMA
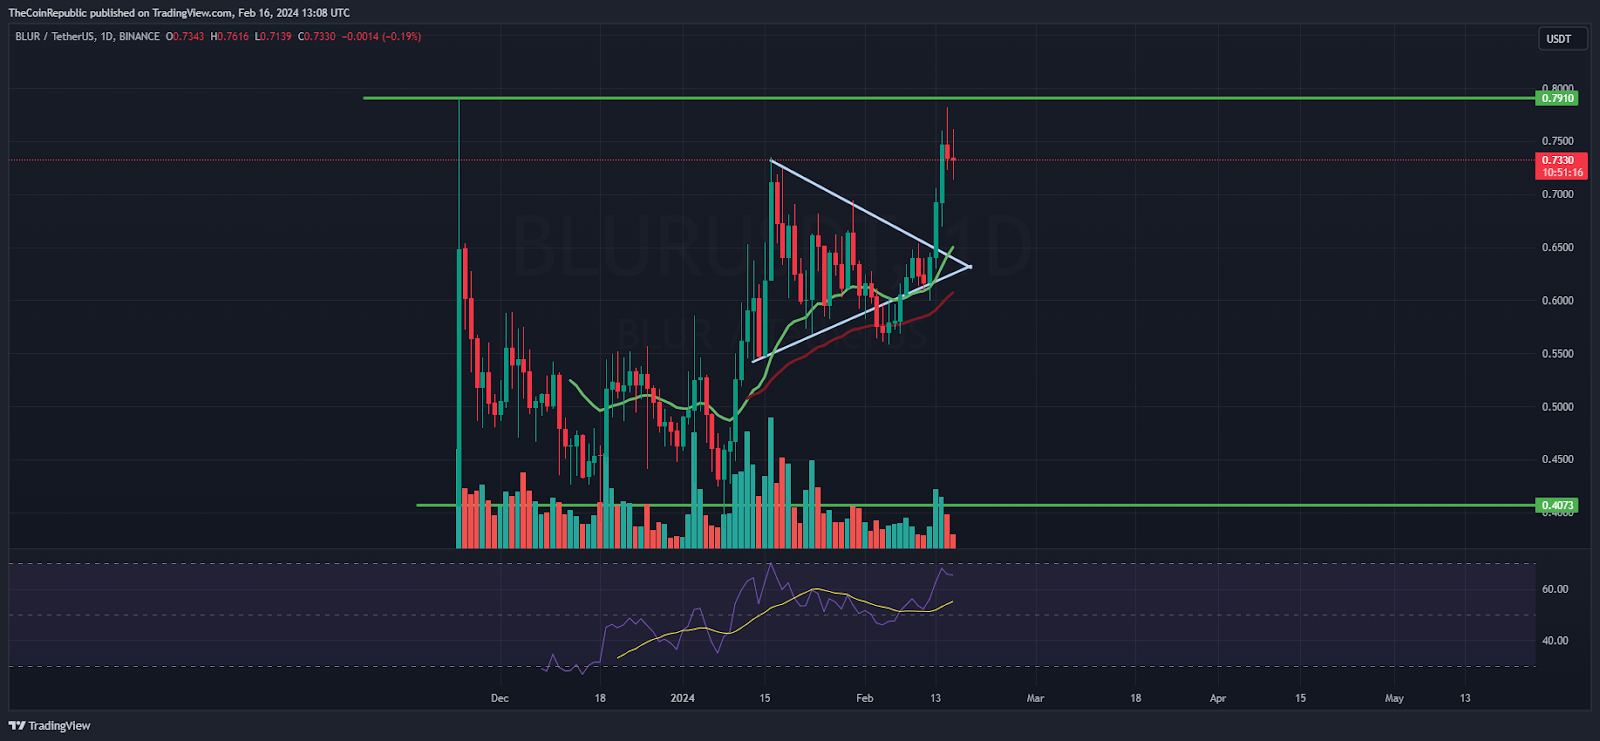
On the daily charts, BLUR token price noted buyer accumulation and rebounded from the 20-Day EMA mark in the last sessions. Moreover, the token has escaped the trajectory hurdle of $0.7200 and is poised to retest the $0.8000 soon. Buyers have gained strength and are continuing in adding long positions which was reflected per the follow on buying activity. Additionally, the token has retained the bullish trajectory and may continue to extend the gains.
The Relative Strength Index (RSI) curve stays in the overbought zone and reflects a positive crossover signifies a bullish outlook. Similarly, the MACD indicator exhibits a bullish crossover and displays green bars on the histogram.
BLUR On Hourly Charts Exhibits Bullish Flag Pattern
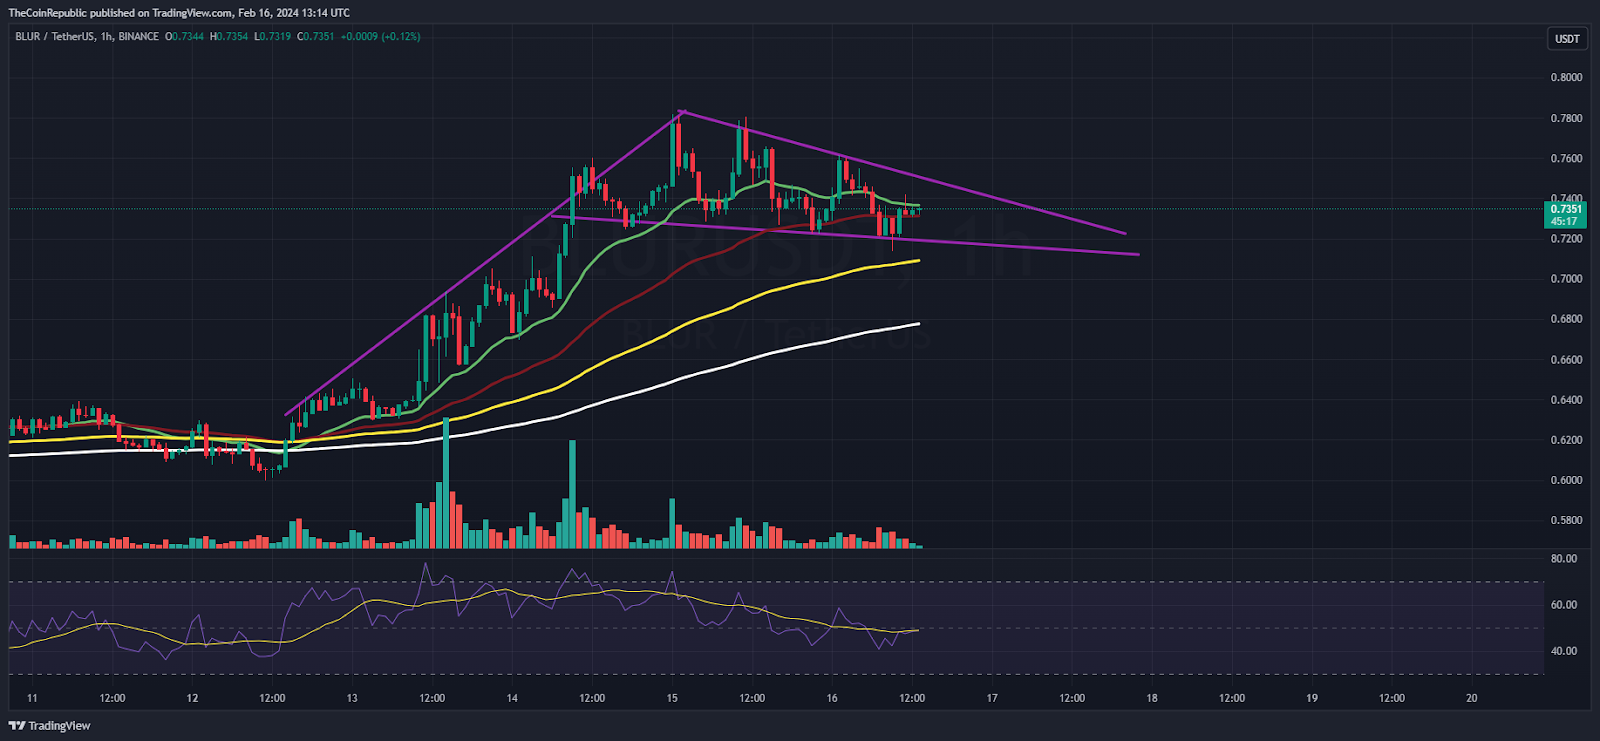
On the hourly charts, the token exhibited a bullish flag pattern and may register a breakout above the trendline of $0.7500 shortly. Moreover, the trend is intact and bulls have holded the gains decisively and are trying to retain the highs of $0.8000 soon. Per the Fib retracement levels, the token has escaped the 50% zone and is close to the 61.8% zone near $0.7600.
Summary
BLUR price has registered a bounce from the 20-Day EMA mark and reflects buyers’ intention of lifting it toward $0.8000 in the next sessions. The chart displays a bullish flag pattern and sellers have stayed on the backfoot and looked trapped. Given the bullish market sentiments, the token is poised to gain upside and may carry forward the rally.
Technical Levels
Support Levels: $0.7200 and $0.7000
Resistance Levels:$0.7800 and $0.8000
Disclaimer
The views and opinions stated by the author or any other person named in this article are for informational purposes only and do not constitute financial, investment, or other advice. Investing in or trading crypto or stocks comes with a risk of financial loss.
Anurag is working as a fundamental writer for The Coin Republic since 2021. He likes to exercise his curious muscles and research deep into a topic. Though he covers various aspects of the crypto industry, he is quite passionate about the Web3, NFTs, Gaming, and Metaverse, and envisions them as the future of the (digital) economy. A reader & writer at heart, he calls himself an “average guitar player” and a fun footballer.


