
 Home
Home News
News
- 1 Manta Network is trading at the level of $2.99852560 with an intraday rise of 0.06% showing a mild bullishness on the daily chart.
- 2 This week MANTA has grown by almost 11.17% showing a bounce from the lower Bollinger band.
- 3 Technical indicators are giving bullish signals.
Manta Network (MANTA) price is showing a mild recovery after touching a lower support level of $2.498443481. Currently, it is trading above the middle Bollinger band showcasing a mild bullishness on the daily chart.
Manta Network is a groundbreaking blockchain platform that has unique features and advantages. Manta Network’s Manta Pacific chain offers fast and cheap transactions using Zk-SNARKs, a technology that protects privacy and enables secure applications for DeFi, social media, and gaming.
Manta Network is preparing for its main net launch in 2024. Many projects have expressed interest in the platform, from private lending to secret NFT markets.
Manta Network makes it easy for developers to use its platform with SDKs and proof keys that allow smooth integration and adoption. Its modular design allows for flexibility and innovation. Even though it is still under development, it has achieved some important goals, such as launching its testnet in May 2023 and releasing its Manta SDK in July 2023.
Manta Network on the Technical Chart
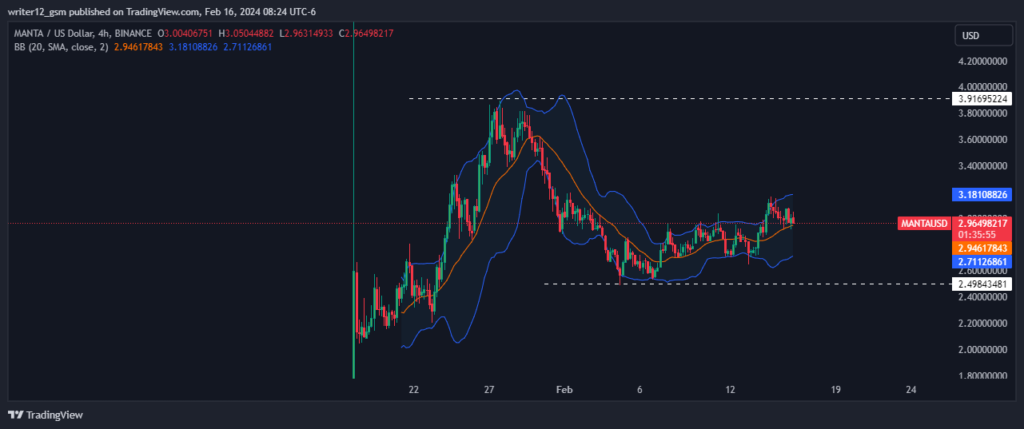
At the time of writing, MANTA was trading at the level of $2.99852560 with an intraday rise of 0.06%, reflecting mild bullishness in the intraday session. This week MANTA has grown by almost 11.17% showing a bounce from the lower support level. The 24-hour trading volume of the crypto is $211.89 Million with a market cap of $747.42 Million.
As per the technical chart, the MANTA Network is trading close to the middle Bollinger band showing the neutral perspective of the price. RSI is heading in the downward direction and below the 14 SMA line showing mild bearishness. The RSI band is currently trading at 52.50 and the 14 SMA line at 59.97 close to the median line.
MACD is trading above the median line. MACD curve is at 0.04607592 and signal curve is at 0.04991183. A bearish crossover is seen in the indicator showing mild bearishness in the price.
Summary
Manta Network not showing any clear sign on the technical chart as most of the indicators are pointing towards the neutrality in the price. Manta Network investors and traders avoid the fear of missing out. Scarcity is created in the crypto market to gain more investors and creditors. It is better to keep it at arm’s length as this may result in one of the emerging reasons for market volatility.
Technical Levels
Support Levels: $3.91695224
Resistance Levels: $2.49843481
Disclaimer
This article is for informational purposes only and does not provide any financial, investment, or other advice. The author or any people mentioned in this article are not responsible for any financial loss that may occur from investing in or trading. Please do your research before making any financial decisions.
Mr. Pratik chadhokar is an Indian Forex, Cryptocurrencies and Financial Market Advisor and analyst with a background in IT and Financial market Strategist. He specialises in market strategies and technical analysis and has spent over a year as a financial markets contributor and observer. He possesses strong technical analytical skills and is well known for his entertaining and informative analysis of the Financial markets.


