
 Home
Home News
News

- 1 VET price chart reflects a breakout and has sharply risen toward $0.05000.
- 2 Buyers have shown their potency and are looking to claim $0.5500 soon.
Vechain token price noted a tremendous up move and aggressively fled the trajectory hurdle of $0.04500, rallying toward the $0.05000 mark. However, the VET price is close to $0.05000 and tried to strike the zone. The price broke the trendline in an intense rebound from the 50-day EMA. Moreover, this bounce has triggered short covering moves.

VET price has overtaken the key moving averages and reached bullish territory, reflecting buyer dominance. Furthermore, the trend is intact, and the token may continue to stretch the rally and claim the upside of $0.05200 shortly. In a recent tweet by @vechainofficial, the company is set to participate in the MWC 24 conference, highlighting the positive sentiment. Besides, a sharp buying momentum was witnessed in the last sessions. The company will share its vision and new development plan at the conference, which will be held on Feb 28 in Barcelona.

The Vechain token (VET) price was $0.04883 at press time, with a massive intraday gain of 23.22%, showing bullishness on the charts. Moreover, the trading volume increased by 585.33% to $1.02 Billion, highlighting investor interest. The pair of VET/BTC is at 0.000000941 BTC, and the market cap rose to $3.27 Billion. Analysts are bullish and suggest that the VET price will continue to extend gains and may reach $0.5500 soon.
VET On Daily Charts Noted Sharp Buying Movement
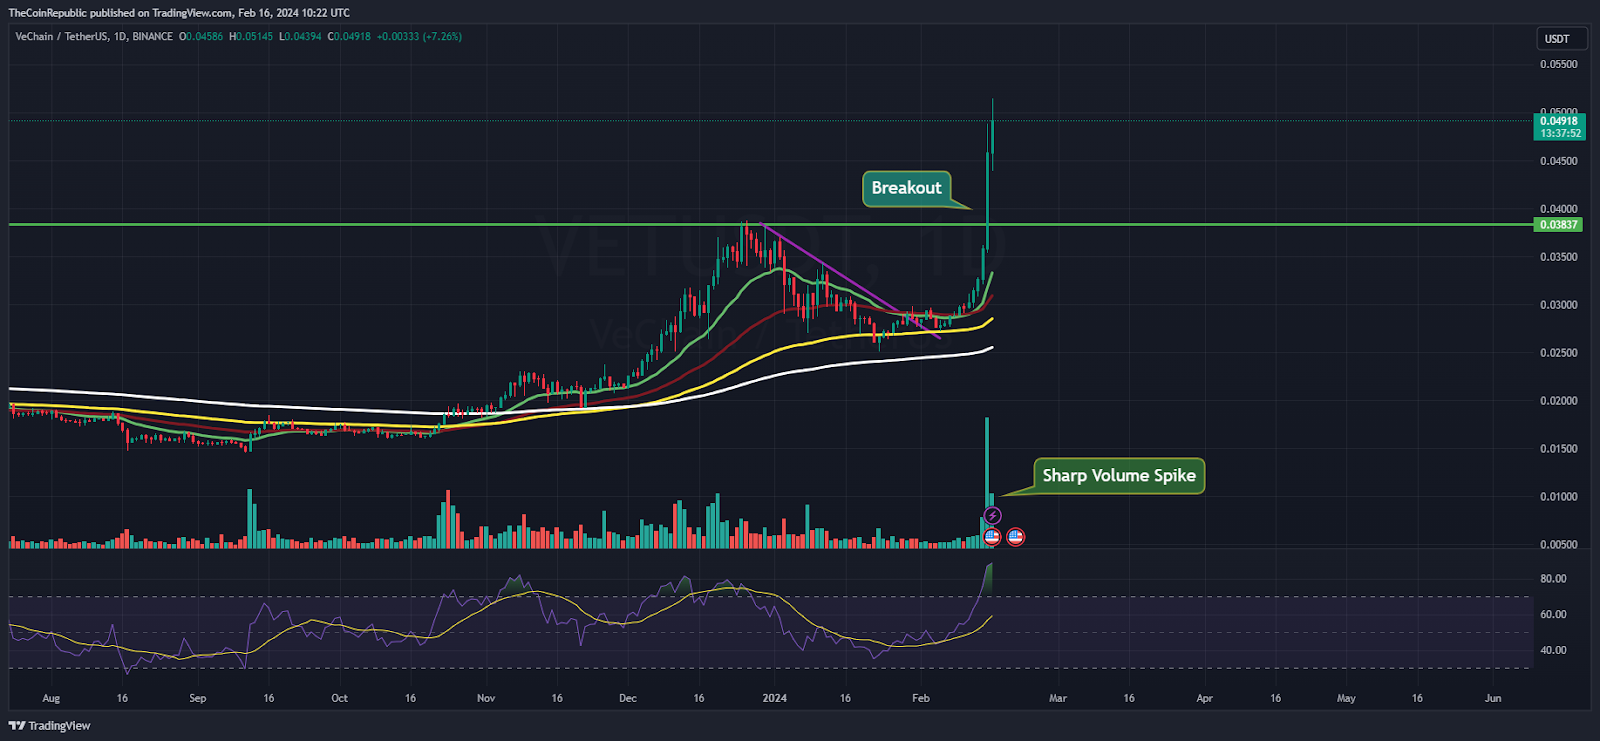
On the daily chart, the VeChain token price sharply surged above its prompt hurdle of $0.4500 and is directing gains toward $0.5000 to claim. In the same way, a sharp spike in trading volume highlights institutional buying activity in the last few sessions, which led to a jump of over 70% in the previous two sessions. The massive bullish marubozu candlestick indicates buyer accumulation.
The Relative Strength Index (RSI) curve sharply rose toward 75 in the overbought zone and glimpses a positive crossover on the charts. Moreover, the MACD indicator shows a bullish crossover, and the green bars formed on the histogram suggest a bullish outlook for the coming sessions.
VET On Weekly Charts Reveals Bullish Crossover
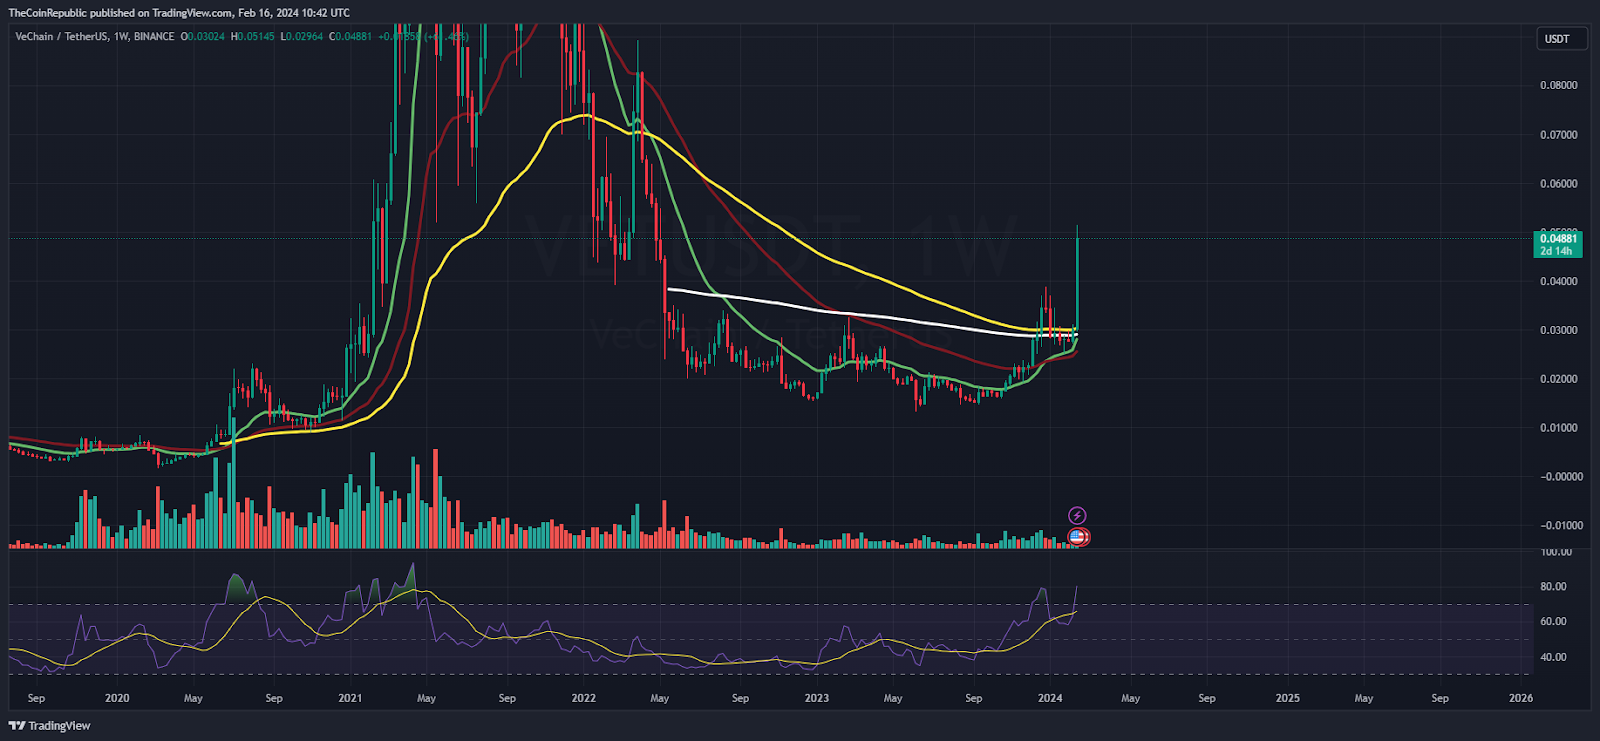
On the weekly chart, a massive breakout candlestick above the 200-day EMA mark was noted, which exhibits strong buying momentum. The chart shows a bullish crossover, signaling a breakout that may carry forward to the highs of $0.05500 in the following sessions.
Summary
Vechain token has gained buying momentum and is ready to spark fireworks in the upcoming sessions. The Bulls are clearly dominating the Bears, as shown by the massive bounce in the last few sessions.
Technical Levels
Support Levels: $0.04500 and $0.04300
Resistance Levels:$0.05000 and $0.05300
Disclaimer
The views and opinions stated by the author or any other person named in this article are for informational purposes only and do not constitute financial, investment, or other advice. Investing in or trading crypto or stocks comes with a risk of financial loss.

Amanda Shinoy is one of the few women in the space invested knee-deep in crypto. An advocate for increasing the presence of women in crypto, she is known for her accurate technical analysis and price prediction of cryptocurrencies. Readers are often waiting for her opinion about the next rally. She is a finance expert with an MBA in finance. Quitting a corporate job at a leading financial institution, she now engages herself full-time into financial education for the general public.


