
 Home
Home News
News

- 1 The Cardano price noted a range breakout and suggests a bull rally soon.
- 2 Buyers are gaining momentum and are targeting to reach the $1 mark.
Cardano (ADA) has given a much-awaited range breakout, which was floated on the charts after a year. The price action suggests that the coin may continue gaining strength and extend the bullish rally toward $1 in the following sessions. During 2021, a sharp range breakout was triggered after a long consolidation, and the coin rallied by over 800%. Analysts gave their opinion that the coin may repeat history and surge over 1230%. If it crosses the $1.40 mark, the $3 and $6 upside doors will unlock.

ADA crypto price has bounced back from the lows of $0.2300 and recovered over 110% in the last sessions. Moreover, the coin has surpassed the key moving averages and is poised to crack the round mark of $1 soon. Following the market surge, the coin gained momentum and conveyed the bulls’ intent of heading toward the blue sky zone of $2.

The Cardano coin (ADA) price was $0.5898 at press time, with an intraday drop of 1.31%, reflecting neutrality on the charts. Moreover, the trading volume decreased by 10.20% to $469.75 Million. The pair of ADA/BTC is at 0.0000114 BTC, and the market cap is $21.54 Billion. Analysts are neutral and suggest that the ADA price will retest the upside of $1.00 in the following sessions.
ADA On Daily Charts Reveals Falling Wedge Breakout
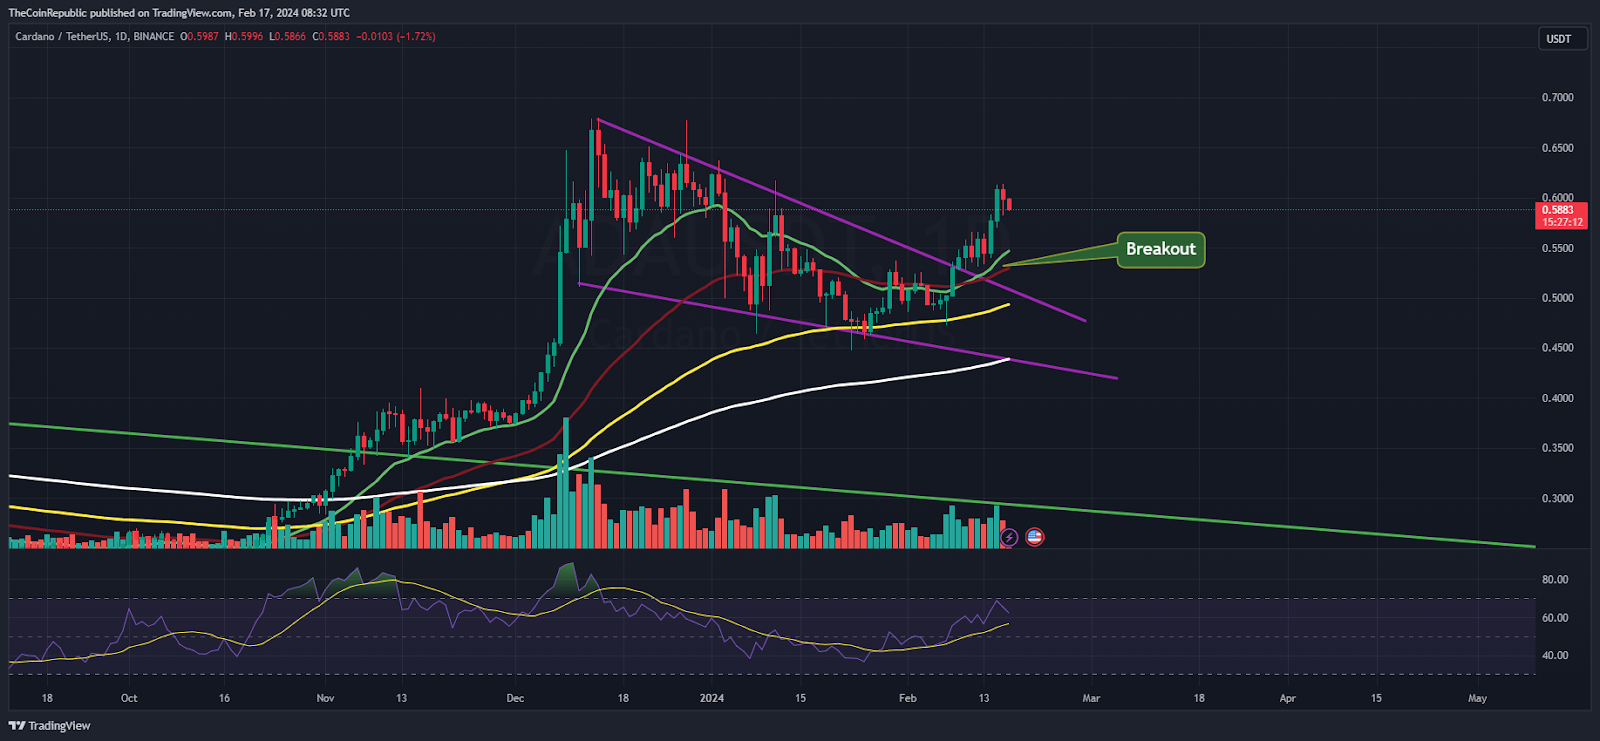
On the daily charts, the Cardano price shows a falling wedge breakout and noted buyer accumulation in the recent sessions. Moreover, the price action signifies the rebound from the 20-day EMA mark, and fresh buying momentum could soon lead ADA price toward the high of $1. Additionally, the trend is intact, and the coin may continue to stretch the highs.
The Relative Strength Index (RSI) curve stays in the overbought zone and forms a positive crossover, replicating a favorable upside on the charts. Similarly, the MACD indicator shows a bullish crossover and suggests an outperformance outlook for the following sessions.
ADA On Weekly Charts Exhibits Descending Triangle Formation
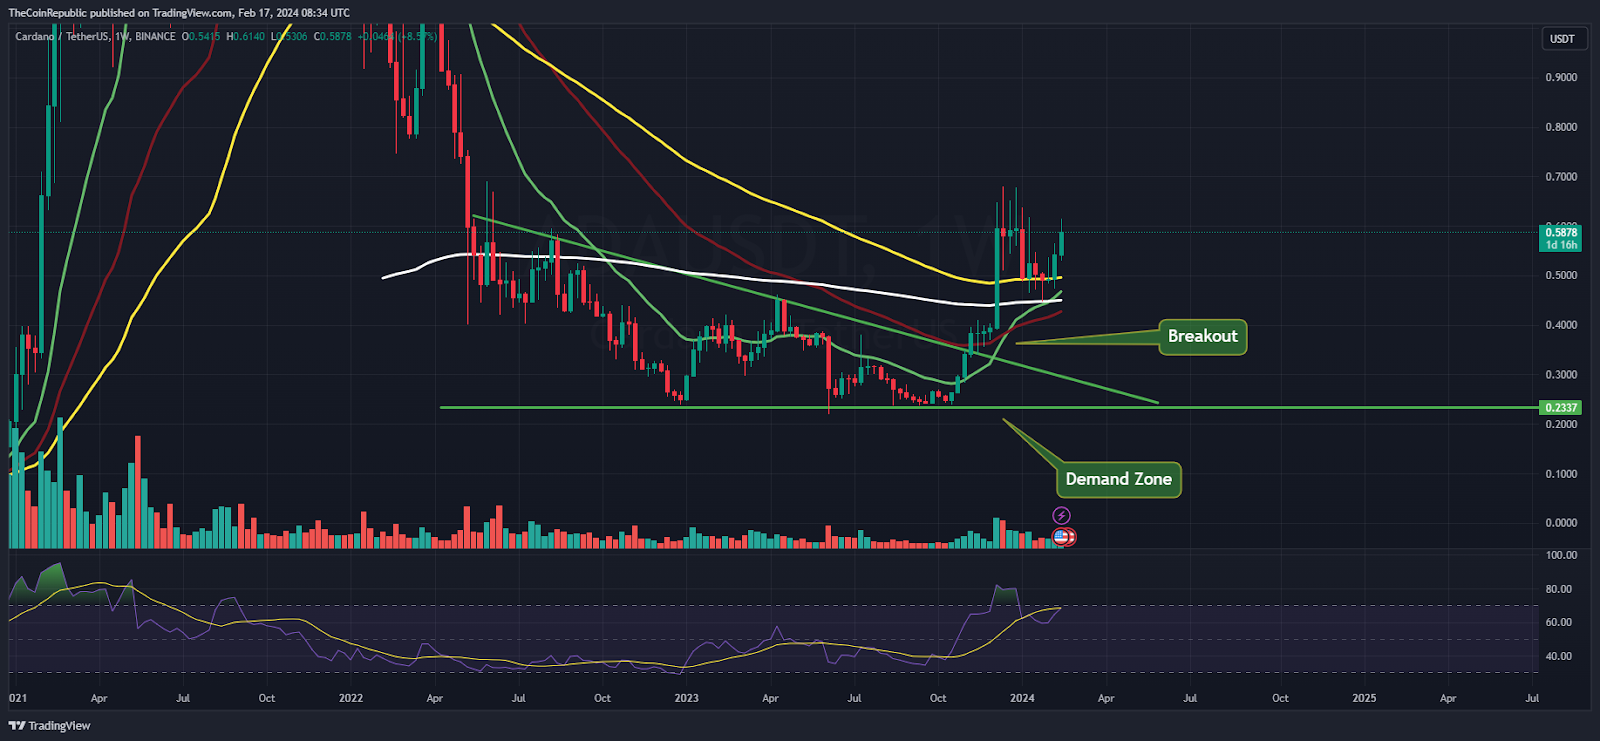
On the weekly charts, the Cardano coin signifies a descending triangle pattern and shows a yearly breakout above the crucial hurdle of $0.4600. Afterward, the coin reached a high of $0.6700. However, the coin has retested the breakout region and is looking for a pullback toward $0.7000.
Summary
The Cardano (ADA) coin signifies buyer accumulation and has shown a pullback from the support zone of $0.4500. Additionally, the coin has registered a breakout and will soon retest the critical resistance mark of $0.6800.
Technical Levels
Support Levels: $0.5500 and $0.5200
Resistance Levels:$0. 6000 and $0.6200
Disclaimer
The views and opinions stated by the author or any other person named in this article are for informational purposes only and do not constitute financial, investment, or other advice. Investing in or trading crypto or stocks comes with a risk of financial loss.

Amanda Shinoy is one of the few women in the space invested knee-deep in crypto. An advocate for increasing the presence of women in crypto, she is known for her accurate technical analysis and price prediction of cryptocurrencies. Readers are often waiting for her opinion about the next rally. She is a finance expert with an MBA in finance. Quitting a corporate job at a leading financial institution, she now engages herself full-time into financial education for the general public.


