
 Home
Home News
News
- 1 RSR token price is heading to retest $0.003000, reflecting buying momentum.
- 2 The token rebounded from the support mark of $0.002100 in the last weeks.
Reserve Rights (RSR) token price regained momentum and glimpsed rebound from the key support area of $0.002100. Afterward, the token continued to stretch the reversal, the follow-on buying momentum was seen in the last few sessions. Amid a pleasant market atmosphere, positive investor interest is clearly visible on the RSR chart.
RSR token price has escaped the key moving averages and is heading to cross the round mark of $0.003000, which if surpassed, the sellers will be trapped and further short covering move will trigger. Furthermore, the token has revamped from the bearish region and retracement was done. The token is ready to sparkle the bullishness and will cross the immediate hurdle of $0.003000 in the next sessions.

The Reserve Rights token (ROSE) price was $0.002877 at press time, with an intraday gain of 2.10%, reflecting buyer accumulation on the charts. Moreover, the trading volume increased by 5.70% to $12.33 Million. The pair of RSR/BTC is at 0.0000000555 BTC, and the market cap is $51.28 Million. Analysts are neutral and suggest that the price will retest the upside of $0.003000 in the following sessions.
RSR On Daily Charts Displays Buyer Accumulation
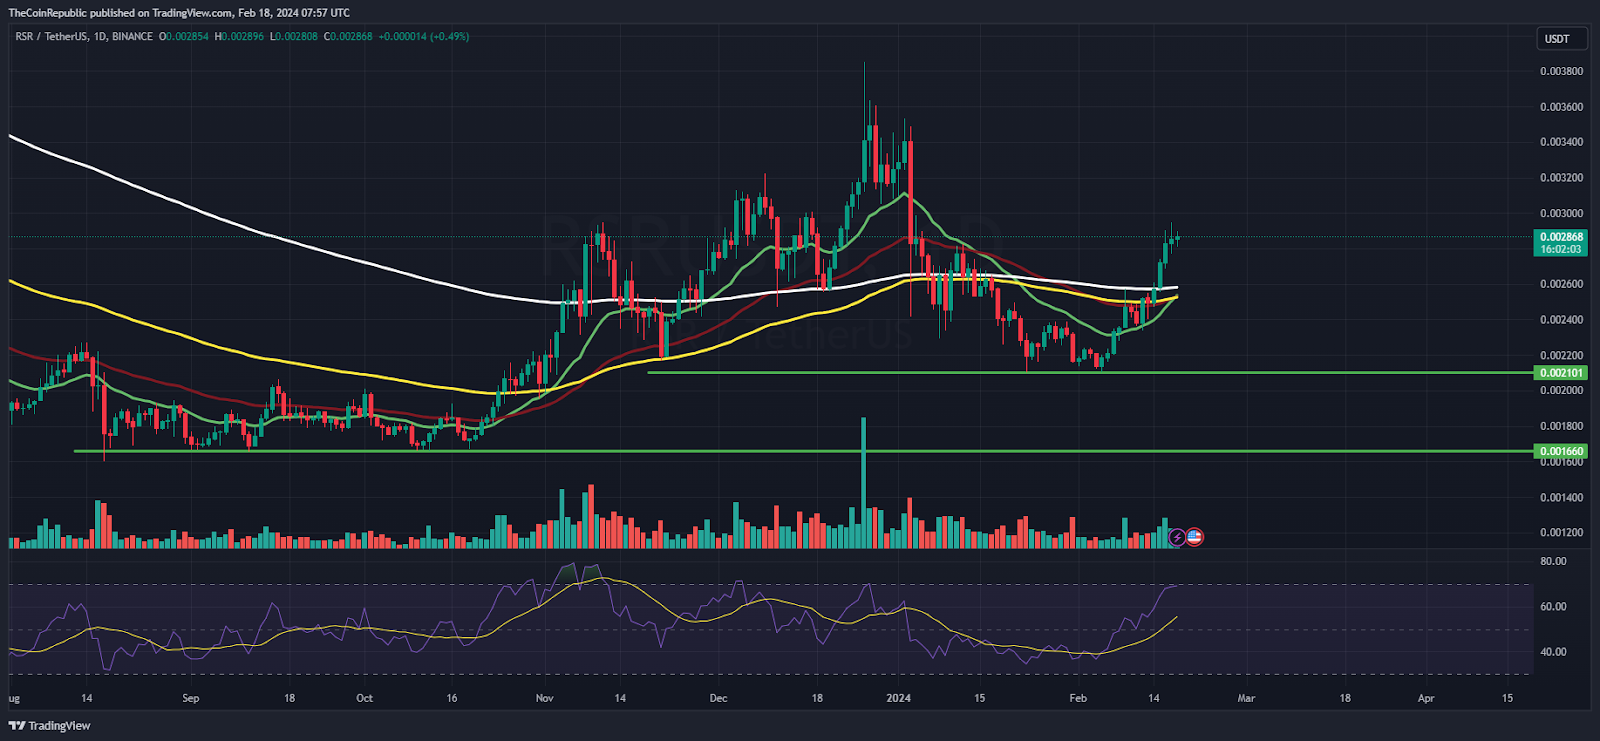
On the daily charts, the token price has retested the crucial support and round mark of $0.002000, from where a remarkable pullback was noted. Afterward, the token managed to push a little further, slowly and steadily sustaining in the neutral region. Furthermore, the token has escaped the 200-Day EMA mark and the technicals are signalling a continuation of uptrend for the next sessions.
The Relative Strength Index (RSI) curve jumped from the oversold region to the overbought zone and noted a positive divergence signals the buying movements on the charts. Moreover, the MACD chart shows a bullish crossover and noted green bars on the histogram suggesting outperformance for the coming sessions.
RSR On Weekly Charts Reveals Rejection From 50-Day EMA

On the weekly charts, Reserve Rights token price was in a narrow range and faced rejection from the 50-Day EMA zone. Moreover, the token did not showcase any major up move and is yet to cross the resistance zone of $0.003500 to register a reversal. Per the Fib levels, the token has sustained above the 23.6% zone and is looking to escape the 38.2% zone to acquire bullishness.
Summary
Reserve Rights (RSR) acquired buying momentum and signifies a trend reversal in the last few sessions. Moreover, the token has jumped over 30% this week reflecting investor interest. Furthermore, the token is heading the reversal to retain the round mark of $0.003000, which if surpassed, a significant up move can be seen shortly.
Technical Levels
Support Levels: $0.002700 and $0.002500
Resistance Levels:$0.003000 and $0.003200
Disclaimer
The views and opinions stated by the author or any other person named in this article are for informational purposes only and do not constitute financial, investment, or other advice. Investing in or trading crypto or stocks comes with a risk of financial loss.

Amanda Shinoy is one of the few women in the space invested knee-deep in crypto. An advocate for increasing the presence of women in crypto, she is known for her accurate technical analysis and price prediction of cryptocurrencies. Readers are often waiting for her opinion about the next rally. She is a finance expert with an MBA in finance. Quitting a corporate job at a leading financial institution, she now engages herself full-time into financial education for the general public.


