
 Home
Home News
News

- 1 AAVE crypto price is currently trading at $94.74 with a drop of 1.54% in the last 24 hours with a market cap of $1.40 Million.
- 2 AAVE crypto price decreased by 2.02% over the past month.
AAVE price prediction suggests that the price is bouncing back by breaking above the key moving averages showcasing the bullishness on the daily chart.

Over the week, AAVE crypto experienced an increase of approximately 4.78%, and over the month its price declined, reaching around 2.02%. Looking back over three months, AAVE cryptos gained about 12.88%, while the incline extended to around 66.73% over the last six months. Furthermore, the crypto’s performance throughout the year has been volatile, with a year-to-date slump of approximately 12.22%.
At press time, the AAVE crypto price was $93.55, with an intraday loss of 2.82%, showing bearishness on the charts. Moreover, the trading volume is 127.79 Million. The market cap is $1.40 Billion. Moreover, indicators maintained a by rating on the trading view.

Technical Analysis of AAVE Crypto Price in 1-D Timeframe
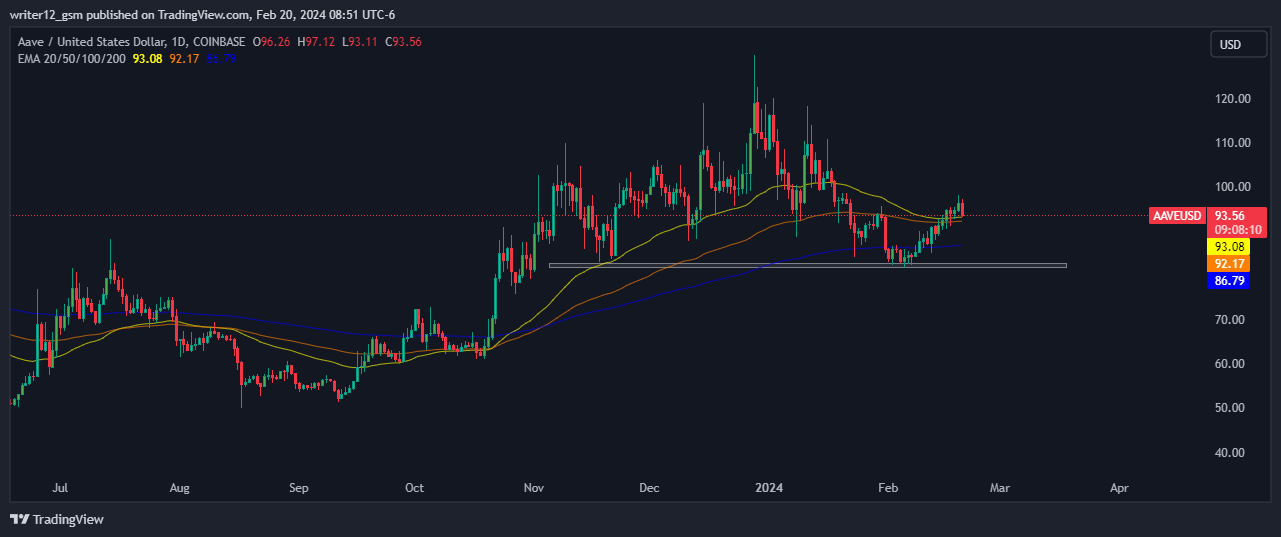
AAVE (USD: AAVE) has seen its crypto price rise steadily for the past few days, gaining 18% from the bottom support. At the time of writing, AAVE crypto is trading at a bullish pace after a pullback.
If it can keep this level, the AAVE price could continue to go up and reach the first and second targets of $100 and $110.00. However, if the AAVE price cannot maintain this level and falls, then it might hit the closest support levels of $86.00 and $80.00.
At the time of publishing, AAVE crypto (USD: AAVE) is trading above the 50 and 200-Day EMAs (exponential moving averages), which supports the price trend.
However, if buying volume counts up then the price might conquer the upper levels by making higher high structures. AAVE is expected to move upward giving bullish views over the daily time frame chart.
The current value of RSI is 53.43 points. The 14 SMA is above the median line at 50.20 points which indicates that the AAVE crypto is bullish. The MACD line at 0.50 and the signal line at 9.35 are above the zero line. A bullish crossover was observed in the MACD indicator which signals more strength for the crypto price.
Summary
The technical indicators for AAVE (USD: AAVE) also indicate a bearish trend. The MACD, RSI, and EMAs are showing negative signals and suggesting that the downward trend in the AAVE crypto chart might continue for some time. However, if the buyers provide the desired support, the AAVE crypto price can still rise. Currently, it needs more buyers.
Technical Levels
Support Levels: $100 and $110.00
Resistance Levels: $86.00 and $80.00
Disclaimer
This article is for informational purposes only and does not provide any financial, investment, or other advice. The author or any people mentioned in this article are not responsible for any financial loss that may occur from investing in or trading. Please do your own research before making any financial decisions.

Adarsh Singh is a true connoisseur of Defi and Blockchain technologies, who left his job at a “Big 4” multinational finance firm to pursue crypto and NFT trading full-time. He has a strong background in finance, with MBA from a prestigious B-school. He delves deep into these innovative fields, unraveling their intricacies. Uncovering hidden gems, be it coins, tokens or NFTs, is his expertise. NFTs drive deep interest for him, and his creative analysis of NFTs opens up engaging narratives. He strives to bring decentralized digital assets accessible to the masses.


