
 Home
Home News
News

- 1 Bears were trying to bring down OP, looking aggressive in the previous few sessions.
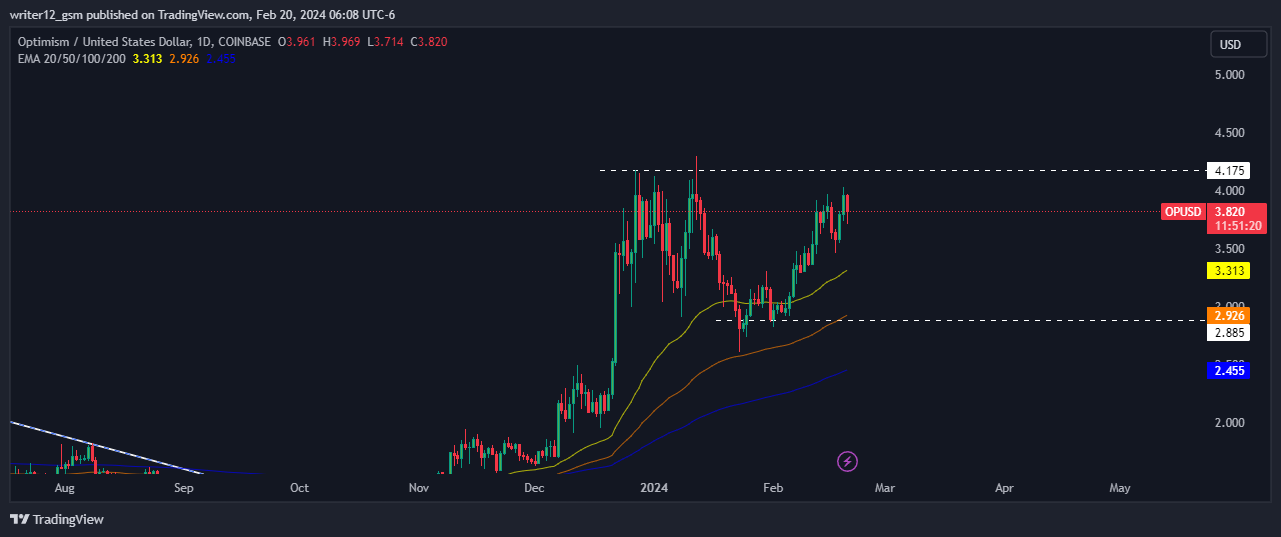
- 2 Before the correction, the OP price peaked at $4.175.
- 3 Optimism price is trading above the key moving averages despite weakness in the trend.
The price of optimism (OP) has been quite volatile in recent months. However, it has failed to break through the resistance zone of $4.175. The price reached a high of $49,000 but has since fallen.

Furthermore, the price has increased by over 19% both above and below the critical resistance level of $3.00 and it has tested the upper level of $4.175. It reached a low of around $2.885 and has been recovering slowly since, with a slight increase above the resistance zone of $3.500.
At the time of writing, the OP was trading at $3.808 with a drop of 3.91%. Its volume has increased by 15.37% in the intraday session. The company’s current market cap is $3.66 Billion and the 24-hour trading volume is 245.22 Million.
The performance of the coin has been volatile throughout the year as it gave a return of approximately 47.93% over the year and a 3.37% return year to date. It gave a return of 145.51% in the previous 6 months, and in the last 3 months, it gave a return of 140.88%.
However, the price is in the bullish phase as it increased by 0.31% in the last week, demonstrating a bull’s presence in the price. Buyers are accumulating the crypto in the $2.50 to $3.50 range.
Out of the 26 indicators on TradingView, 2 are on the sell side, 10 are on the neutral side, and 14 are on the buying side showing the buying perspective.
What Will be the Direction of OP in the Next Trading Sessions?
If OP price surges above the key levels, it might start a fresh incline and might touch the upper levels in the next few sessions. Moreover, the possibility of this looks high because the bulls are pushing the price at higher levels.
Despite the recent weakness the price is still trading above the key moving averages of 50, 100, and 200-Day EMAs. The price took support from the 50-moving average and blasted off to higher levels.
The MACD is trading in the bullish zone and heading in the upward direction, green bars were noticed in the chart showcasing bullishness. The RSI is hovering at 59.34 on the 14-SMA curve, demonstrating the neutral outlook for the price.
Summary
The Optimism price forecast demonstrates a bounce back after a correction phase. Technicals including the MACD, RSI, and EMAs are indicating bullishness on the chart. Other bullish signs include a 0.31% increase over the week and positive return values across timeframes.
Technical Levels
Support Level: $3.312.
Resistance Level: $4.175.
Disclaimer
The analysis provided in this article is for informational and educational purposes only. Do not rely on this information as financial, investment, or trading advice. Investing and trading in crypto involves risk. Please assess your situation and risk tolerance before making any investment decisions.

Steefan George is a crypto and blockchain enthusiast, with a remarkable grasp on market and technology. Having a graduate degree in computer science and an MBA in BFSI, he is an excellent technology writer at The Coin Republic. He is passionate about getting a billion of the human population onto Web3. His principle is to write like “explaining to a 6-year old”, so that a layman can learn the potential of, and get benefitted from this revolutionary technology.


