
 Home
Home News
News
- 1 Celestia crypto has jumped above 20, 50, 100, and 200-Day daily moving averages.
- 2 Bulls are showing their strength and extending the gains.
- 3 Celestia crypto rallied in the previous trading sessions.
Celestia’s price is trading above the key moving averages showcasing the bullishness by making a higher high structure. However, the Buyers are facing tough competition from the sellers.
TradingView data shows that Celestia crypto price is trading at $16.9989 with an intraday loss of 5.45%, indicating a bullish trend. The 24-hour trading volume is 180.33 Million, and the market capitalization stands at $2.81 Billion.
Technical Analysis Of Celestia Crypto On Daily Time Frame
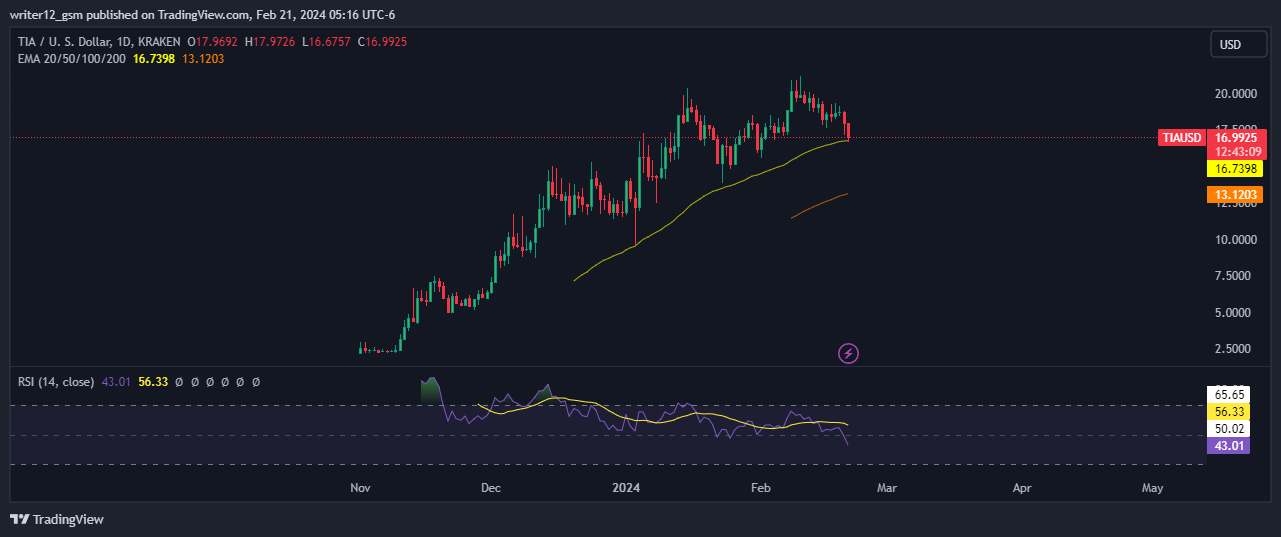
At the time of publishing, Celestia crypto (USD: TIA) is trading above the 50 and 200-Day EMAs (Exponential moving averages), which are supporting the price trend.
The current value of RSI is 42.84 points. The 14 SMA is above the median line at 56.32 points which indicates that the Celestia crypto is bullish.
The MACD line at 0.2811 and the signal line at 0.5761 are above the zero line. A bearish crossover is observed in the MACD indicator which signals mild weakness for the TIA crypto price.
Technical Analysis Of Celestia Crypto On 4-H Time Frame
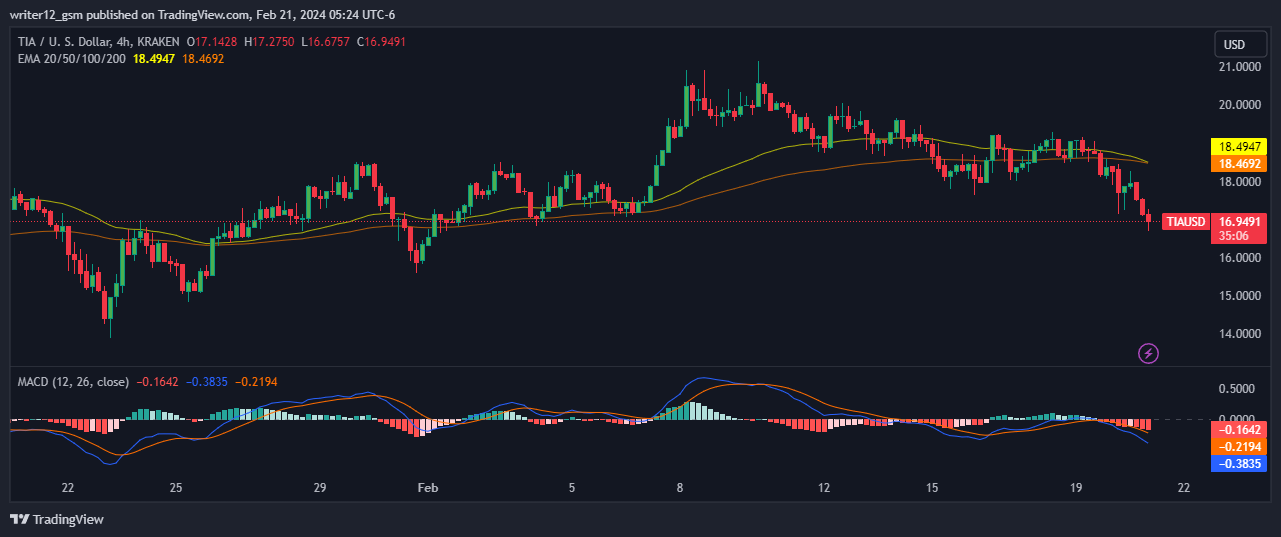
Celestia crypto chart shows bearish strength and the short-term charts suggest negative outcomes in the upcoming days. Moreover, the price is trading below the major EMAs, confirming the negative signals for the upcoming days.
The RSI curve is near 28.79, an oversold zone, with a negative outlook indicating bullish sentiment in the cryptocurrency. The MACD indicator also continued to form a red band and a bearish crossover appeared, indicating a corrective move on the 4-H timeframe.
Technical Analysis Of Celestia Crypto On Weekly Time Frame
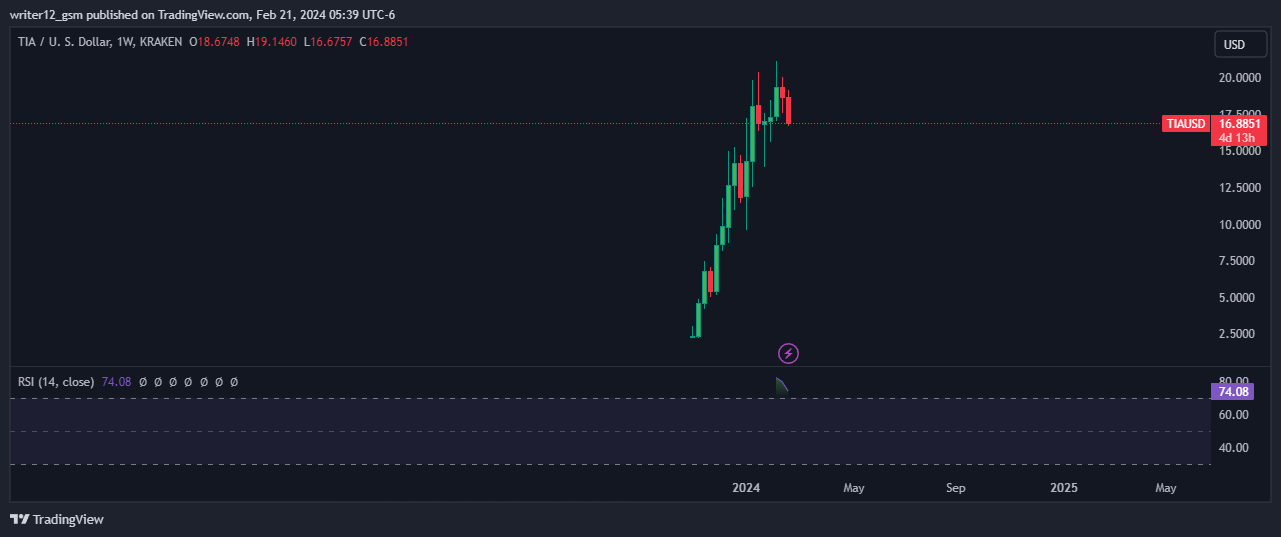
Celestia crypto’s weekly chart shows buyers’ dominance. The cryptocurrency is in an uptrend as it jumped above a key EMA. Technical indicators also support the bullish sentiment as RSI is close to the overbought zone of 74.07 and MACD has formed a bullish crossover with the green band. These signals indicate that the cryptocurrency could face even greater upward pressure in the coming weeks.
Summary
Celestia crypto has been showing a strong performance in the past few months, as it has jumped above the key moving averages and the resistance levels. However, the price struggled to sustain above the $18 level. The price needs to maintain the higher high structure and the support of the EMAs to continue the uptrend. The next target for the bulls is the $20 level, which is a key psychological barrier and a major supply zone. The first support is the $14.8593 level, which is the previous resistance turned support.
Technical Levels
Support Levels: $14.8593 and $13.1165.
Resistance Levels: $18.000 and $20.000.
Disclaimer
This article is for informational purposes only and provides no financial, investment, or other advice. The author or any people mentioned in this article are not responsible for any financial loss that may occur from investing in or trading. Please do your research before making any financial decisions

Adarsh Singh is a true connoisseur of Defi and Blockchain technologies, who left his job at a “Big 4” multinational finance firm to pursue crypto and NFT trading full-time. He has a strong background in finance, with MBA from a prestigious B-school. He delves deep into these innovative fields, unraveling their intricacies. Uncovering hidden gems, be it coins, tokens or NFTs, is his expertise. NFTs drive deep interest for him, and his creative analysis of NFTs opens up engaging narratives. He strives to bring decentralized digital assets accessible to the masses.


