
 Home
Home News
News

- 1 Major credible indicators like the MACD and EMAs are conveying bullish signals for the Fantom price.
- 2 Fantom price reflects a positive outlook and expectations for the crypto asset in the daily chart.
The Fantom crypto has been performing very well on the daily chart. It soared from $0.1770 to $0.5645 in the last quarter of 2023, a whopping 224% increase. However, it faced some resistance at the top and fell into a wedge pattern. But the FTM crypto is showing signs of a reversal, as it bounced from a key support level of around $0.3081 and broke out of the wedge recently.

Can Fantom Crypto Price Show A Thrust Soon?
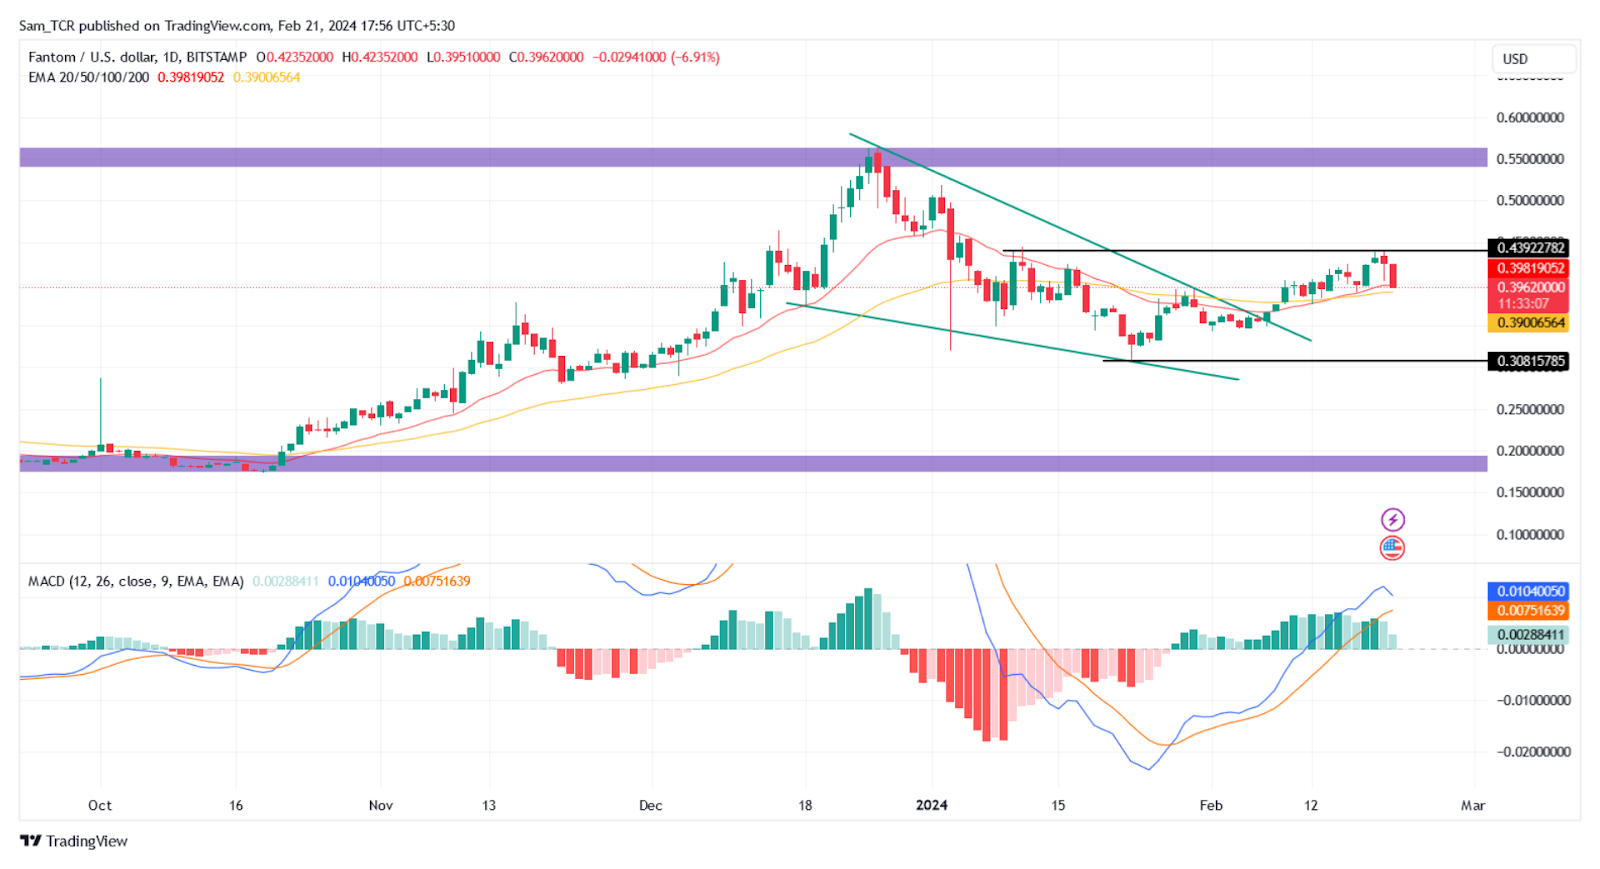
Fantom crypto experienced a minor pullback on Feb 21st as it is stuck below the 20 and 50-Day EMA levels on the daily chart. This suggests that buyers are still optimistic and bullish for the next sessions. Also, in the last 24 hours, the trading volume on all major exchanges was 95.96 Million and the current market price was $0.39876 with a 6.31% drop.

The FTM asset is demonstrating its potential to rise, as it tries to stay above the major trend EMAs. Depending on the buyers’ strength, the price could surge quickly to reach higher targets. In addition, other technical tools such as MACD, indicate bullishness as it is in a positive zone and above the zero line. MACD is at 0.01060, the signal line is at 0.0075, and the histogram is at 0.003047.
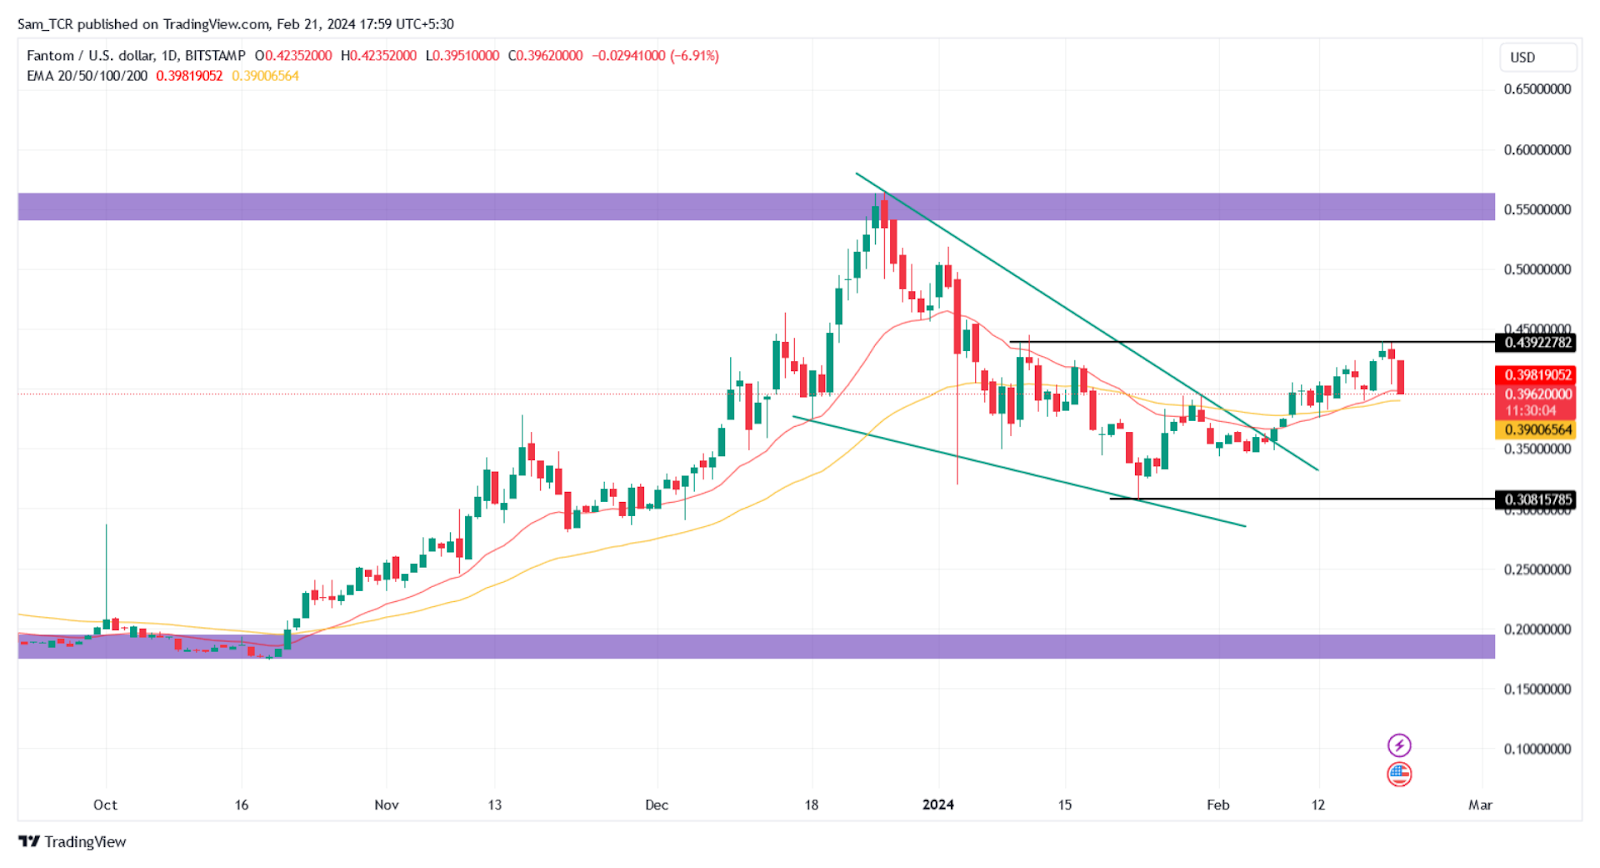
Moreover, the Fantom price structure resembles a bullish pattern known as a falling wedge and according to this structure, the breakout could extend up to $0.550000 as well, with intermediate resistance at $0.439227. If the falling wedge pattern fails and breaks below the 20 and 50-Day EMAs, the price could hit $0.308157 or go lower.
Summary
Fantom price reflects a positive outlook and expectations for the crypto asset in the daily chart. The FTM price shows a bullish trend at the moment.
The technical factors including the MACD and EMAs indicate bullishness in the coming sessions on the daily chart. The Fantom price structure resembles a bullish pattern known as a falling wedge and according to this structure, the breakout could extend up to $0.550000 as well, with intermediate resistance at $0.439227.
Technical Levels
Support Levels: $0.308157
Resistance Levels: $0.439227
Disclaimer
In this article, the views, and opinions stated by the author, or any people named are for informational purposes only, and they don’t establish the investment, financial, or any other advice. Trading or investing in cryptocurrency assets comes with a risk of financial loss.

Amanda Shinoy is one of the few women in the space invested knee-deep in crypto. An advocate for increasing the presence of women in crypto, she is known for her accurate technical analysis and price prediction of cryptocurrencies. Readers are often waiting for her opinion about the next rally. She is a finance expert with an MBA in finance. Quitting a corporate job at a leading financial institution, she now engages herself full-time into financial education for the general public.


