
 Home
Home News
News

- 1 The LTC price signifies the lower lows formation and is replicating profit booking.
- 2 Buyers are struggling to hold on to the gains and are facing pressure.
The Litecoin price slipped below the lower trendline support and signified lower low swings, displaying a downtrend on the charts. Furthermore, the price action showcased consolidating moves. The coin did not escape the cage and hovered in a narrow range for the past weeks. Amidst the market surge, the coin faced rejection from the 200-day EMA and stayed below it.

The LTC price showcased a sell-on-rise outlook and did not register any significant up move amidst the positive market sentiments. Furthermore, the trend is negative, and the coin witnessed range-bound moves, which signifies the low buying interest. Per the Fib retracement levels, the coin was traded above the 23.6% zone but below the 38.2% zone.

The Litecoin (LTC) price was $68.92 at press time, with an intraday drop of 0.18%,
showing neutrality on the charts. Moreover, the trading volume increased by 5.70% to $566.47 Million. The pair of LTC/BTC is at 0.00133 BTC, and the market cap is $5.08 Billion. Analysts are neutral and suggest that the Litecoin (LTC) price will continue to hover below the 200-day EMA mark and may face a selloff soon.
Litecoin Displays Trendline Breakdown On Daily Charts
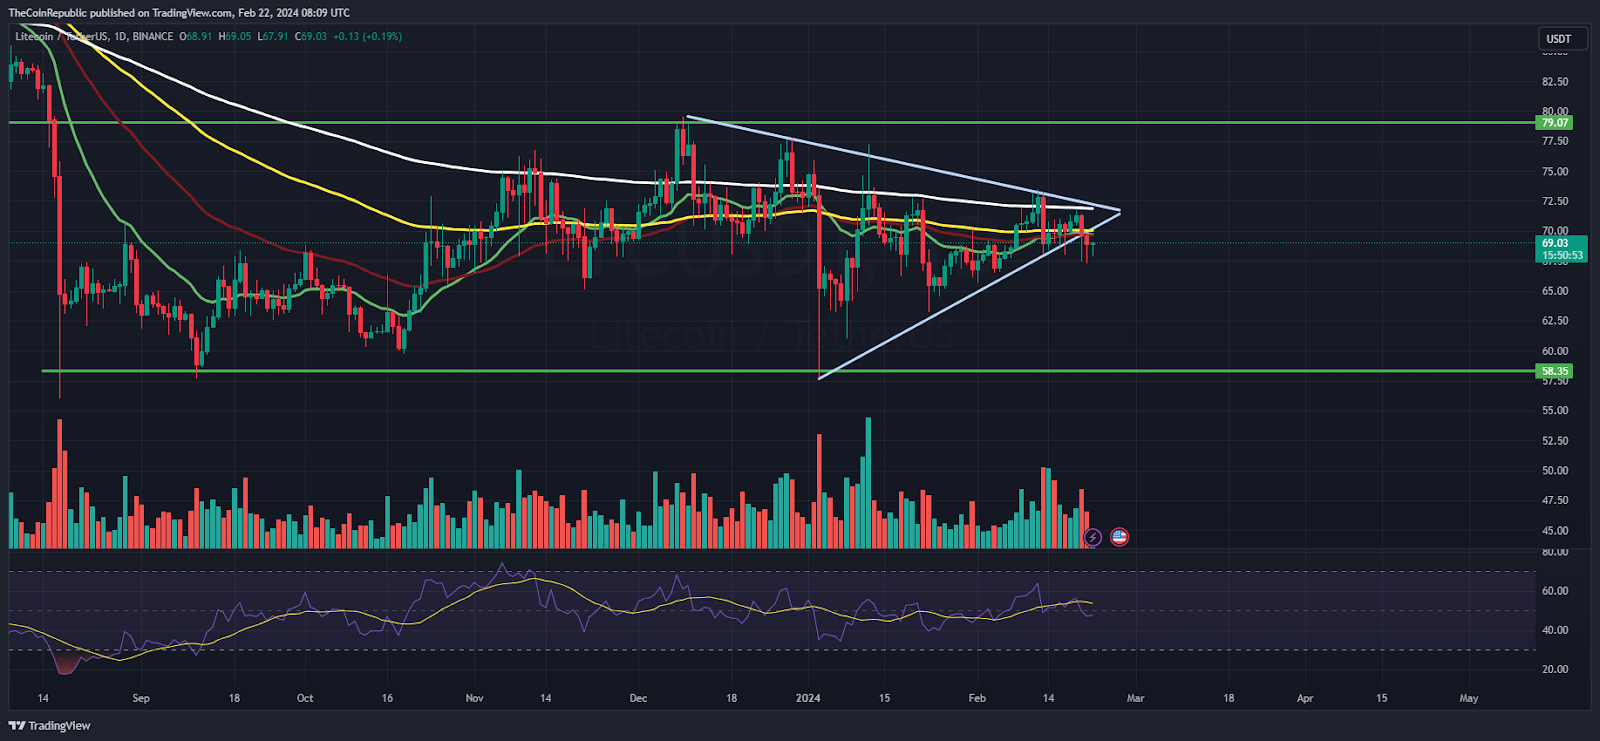
On the daily charts, the Litecoin (LTC) price trades below the key moving averages and depicts dominance of bears. Until the hurdle of $75 is not breached, the trend is negative and follow on selling pressure may drag the coin price consistently. Conversely, if the mark is breached, the coin may go toward $80, followed by $85 sharply. Despite the market uptrend, the LTC coin did not reveal any signs of reversal and stayed in a cage for weeks.
The Relative Strength Index (RSI) curve stays below the neutral line and shows a negative divergence, indicating a bearish momentum. Similarly, the MACD indicator shows a bearish crossover and red bars on the histogram, suggesting a negative outlook for the upcoming sessions.
LTC Guides A Negative Outlook On Weekly Charts
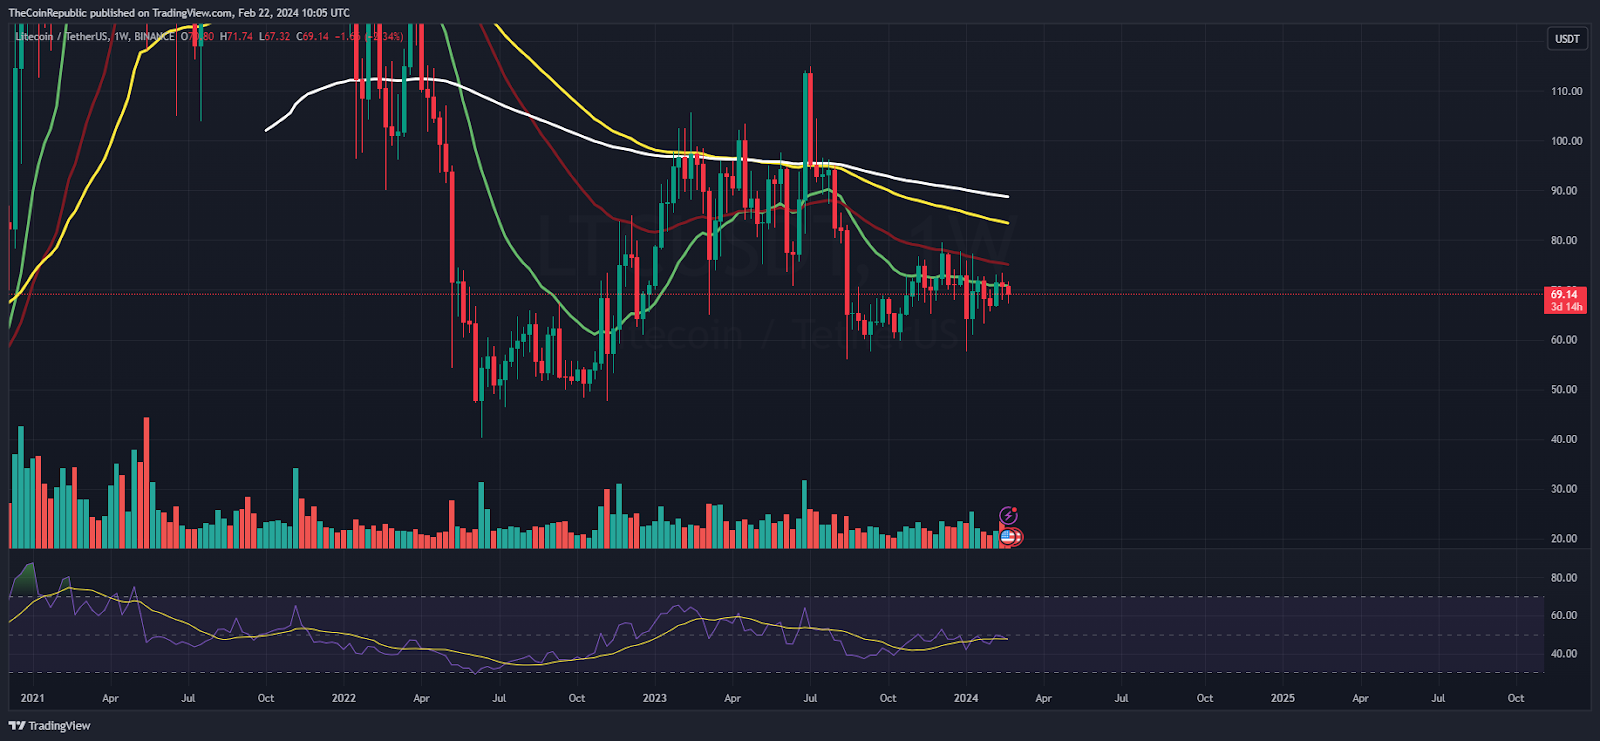
On the weekly charts, the LTC coin witnessed a downtrend and a sharp rejection from the 200-day EMA hints the sellers’ dominance. Furthermore, the price action signifies the underperformance, and the coin may retest the round mark of $50 in the following sessions. With the rejection from the resistance mark of $70, sellers gave a hint of the selloff, which may reflect on the screen soon.
Summary
The Litecoin price breaks below the trendline support level of $70 and signals selling pressure, which may lead to a downside in the upcoming sessions. Moreover, the trend is negative, and bears are willing to push the coin toward the round mark of $50 soon.
Technical Levels
Support Levels: $64 and $60
Resistance Levels:$70 and $75
Disclaimer
The views and opinions stated by the author or any other person named in this article are for informational purposes only and do not constitute financial, investment, or other advice.

Steefan George is a crypto and blockchain enthusiast, with a remarkable grasp on market and technology. Having a graduate degree in computer science and an MBA in BFSI, he is an excellent technology writer at The Coin Republic. He is passionate about getting a billion of the human population onto Web3. His principle is to write like “explaining to a 6-year old”, so that a layman can learn the potential of, and get benefitted from this revolutionary technology.


