
 Home
Home News
News

- 1 Bitcoin Gold price Forecast for March 2024 demonstrates the downturn of the price.
- 2 BTG’s price performance over the week is poor as it gave a bearish return of 3.50%.
- 3 BTG price is currently trading below the 20-Day exponential moving averages, indicating bearishness.
Bitcoin Gold price is mild bearishness currently stuck between the 20-Day moving average, showcasing bearishness on the daily charts. The coin price is halted near the value of $30 and buyers and sellers are still fighting for the price grip.
The crypto price of Bitcoin Gold (USD: BTG) shows signs of weakness, losing the gains it made in the previous months. The BTG crypto price was pushed down by the bears. If buyers fail to maintain the momentum and start to exit their positions, the result will be a decrease in the crypto price.
Bitcoin Gold crypto has been facing bearish pressure in the previous weeks, and facing resistance from the upper resistance levels, which prevented it from breaking out of the trend.

The price action indicates that Bitcoin Gold crypto has been under selling pressure, and the bulls have been passive. On the other hand, the Bears have an advantage and continue to make short positions. However, the trend is still bullish as the price is trading above key moving averages.
Technical Analysis of Bitcoin Gold Crypto Price in 1-D Timeframe
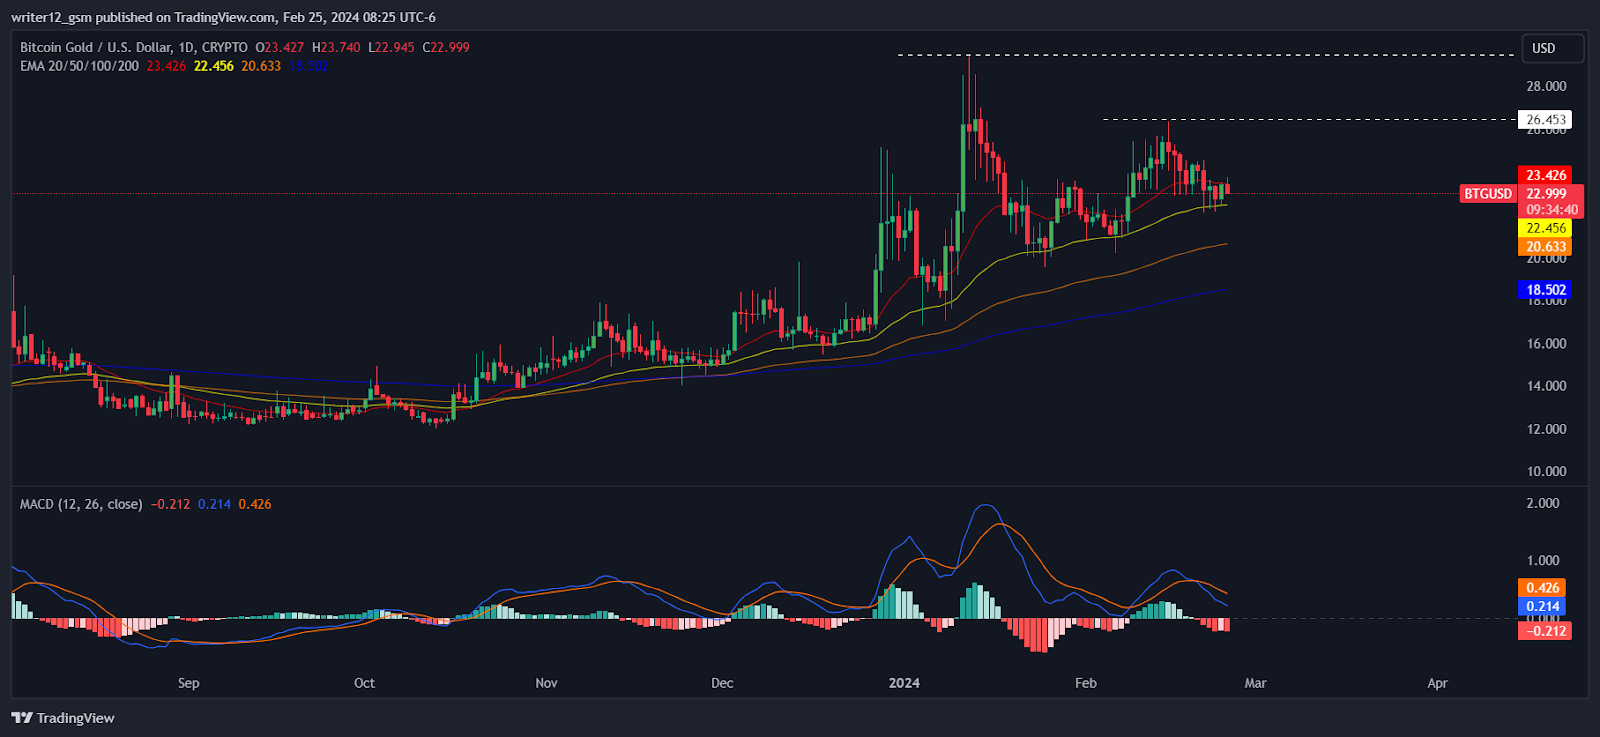
At press time, BTG crypto was trading at $22.985 with an intraday gain of 1.89% breaking below the 20-Day EMA, and showing bearishness on the charts. Moreover, the intraday trading volume is $3.92 Million. The market cap of BTG crypto is $406.94 Million.
Over one week, BTG crypto experienced a decrease of approximately 4.55%. However, in the previous month, it gained almost 12.16%. Looking back over three months, BTG cryptos have gained by about 50.84%, while gaining around 77.37% over the last six months. Furthermore, the crypto’s performance throughout the year has been good, with a year-to-date gain of approximately 9.68%.
Bitcoin Gold crypto is currently trading below the 20-Day EMA, which does not support the price trend. However, the price could break below these EMAs and move lower if selling pressure increases.
The RSI indicator is currently at 48.18, which is in the neutral zone. However, the 14-Day SMA is above the RSI curve, which is a bearish signal. The MACD indicator is also negative, with the MACD line moving under the signal line. It shows that the Bitcoin Gold crypto may continue to drop.
In general, the technical indicators imply that Bitcoin Gold crypto is in a short term downtrend. However, if it can hold the current level, it could go up in the long term.
Summary
Bitcoin Gold (USD: BTG) technical analysis suggests a mild bearish trend. The MACD, RSI, and EMAs are emphasizing bearish signals. However, in the long term, the crypto is bullish. Bitcoin Gold price action suggests that the investors and traders are bearish on the 1-D time frame. The price action mirrors a bearish perspective at the moment.
Technical Levels
Support Level: $22.456.
Resistance Level: $26.456.
Disclaimer
This article is for informational purposes only and does not provide any financial, investment, or other advice. The author or any people mentioned in this article are not responsible for any financial loss that may occur from investing in or trading. Please do your own research before making any financial decisions.

Steefan George is a crypto and blockchain enthusiast, with a remarkable grasp on market and technology. Having a graduate degree in computer science and an MBA in BFSI, he is an excellent technology writer at The Coin Republic. He is passionate about getting a billion of the human population onto Web3. His principle is to write like “explaining to a 6-year old”, so that a layman can learn the potential of, and get benefitted from this revolutionary technology.


