
 Home
Home News
News
- 1 COREUM token price signifies selling pressure and declined persistently.
- 2 Buyers have lost their strength and are trying to hold the gains.
The Coreum token (COREUM) price persisted in dragging the gains and indicated severe selling pressure for the past few sessions. Moreover, the token has corrected from the highs of $0.32000 and eroded over 50% of gains this month, highlighting bearishness. However, the token has dragged close to the demand zone, and a bounce could be seen soon.
COREUM token price slipped below the significant moving averages, revealing a panic fall on the charts. The mighty bears continued forcing the bulls and adding short positions, leading in a follow-on selling pressure. The token denoted lower low swings and cannot settle the gains amidst the bullish crypto market depicting low investor interest.
The Coreum token (COREUM) price was $0.1462 at press time, with an intraday drop of 0.48%, showing bearishness on the charts. Moreover, the trading volume has increased by 2.21% to $1.64 Million. The pair of COREUM/BTC is at 0.00000283 BTC, and the market cap is $56.52 Million. COREUM crypto has a negative monthly return ratio of (-7.89) % and (-76.32)% on a yearly basis. Analysts are bearish and suggest that the Coreum crypto (COREUM) price will continue to face a selloff and may retest $0.1000 soon.
COREUM Reveals Follow On Selling Pressure On Daily Charts
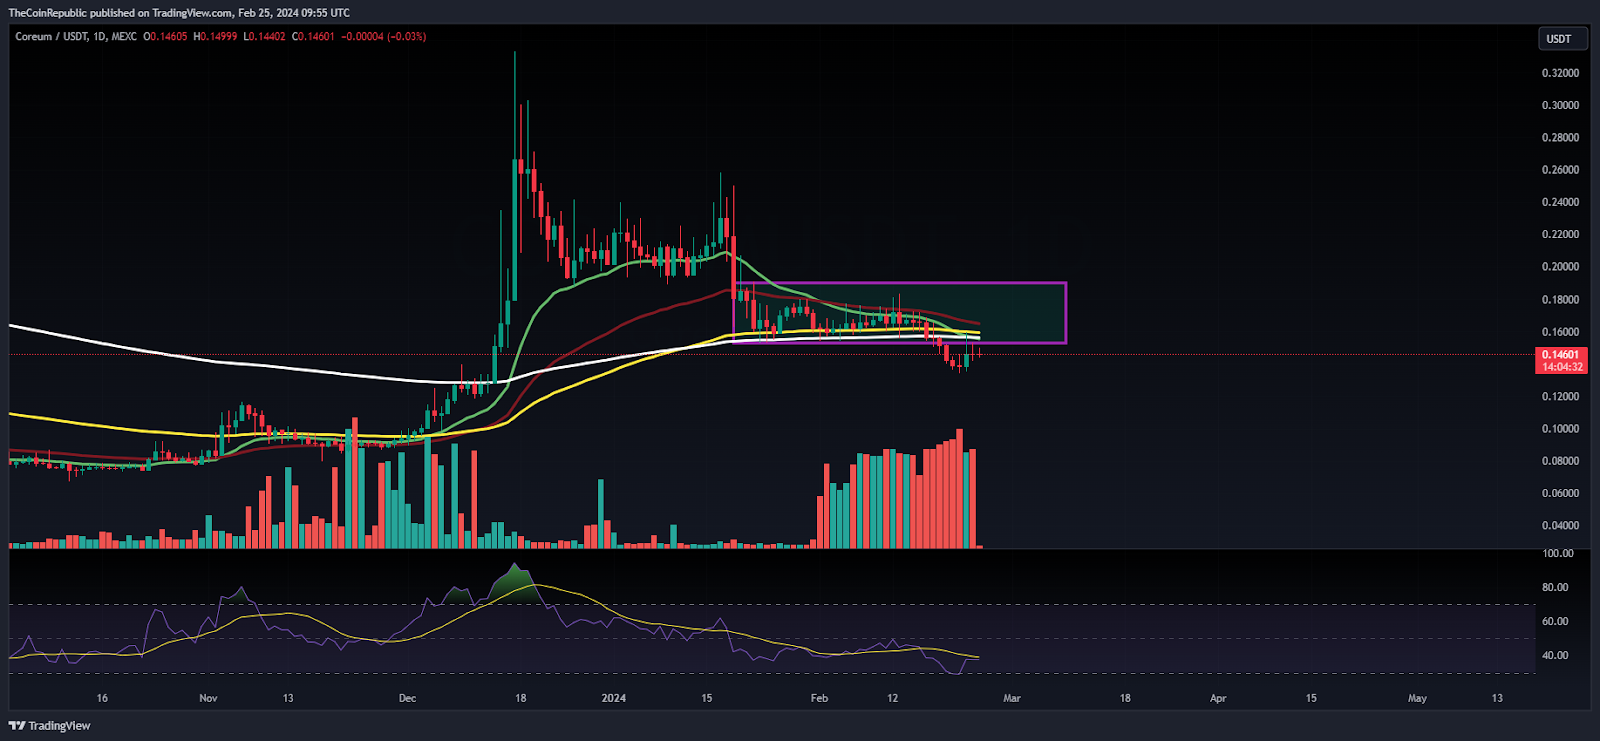
On the daily charts, the token persisted in declining the gains and was in a downtrend for the past weeks. The token could not manage to hold out at any support zone and was dragged below the 200-Day EMA zone, which exhibits bearish dominance. Furthermore, the token has breached the range neckline of $0.1500 and is initiating yet another selloff, which may soon lead the token toward $0.1000.
The RSI curve stayed in the oversold region, reflecting a negative crossover. Moreover, the MACD indicator shows a bearish crossover, and the red bars formed on the histogram suggest underperformance for the following sessions.
COREUM Exhibits Panic Selloff, Can Bulls Secure $0.1000 Mark?
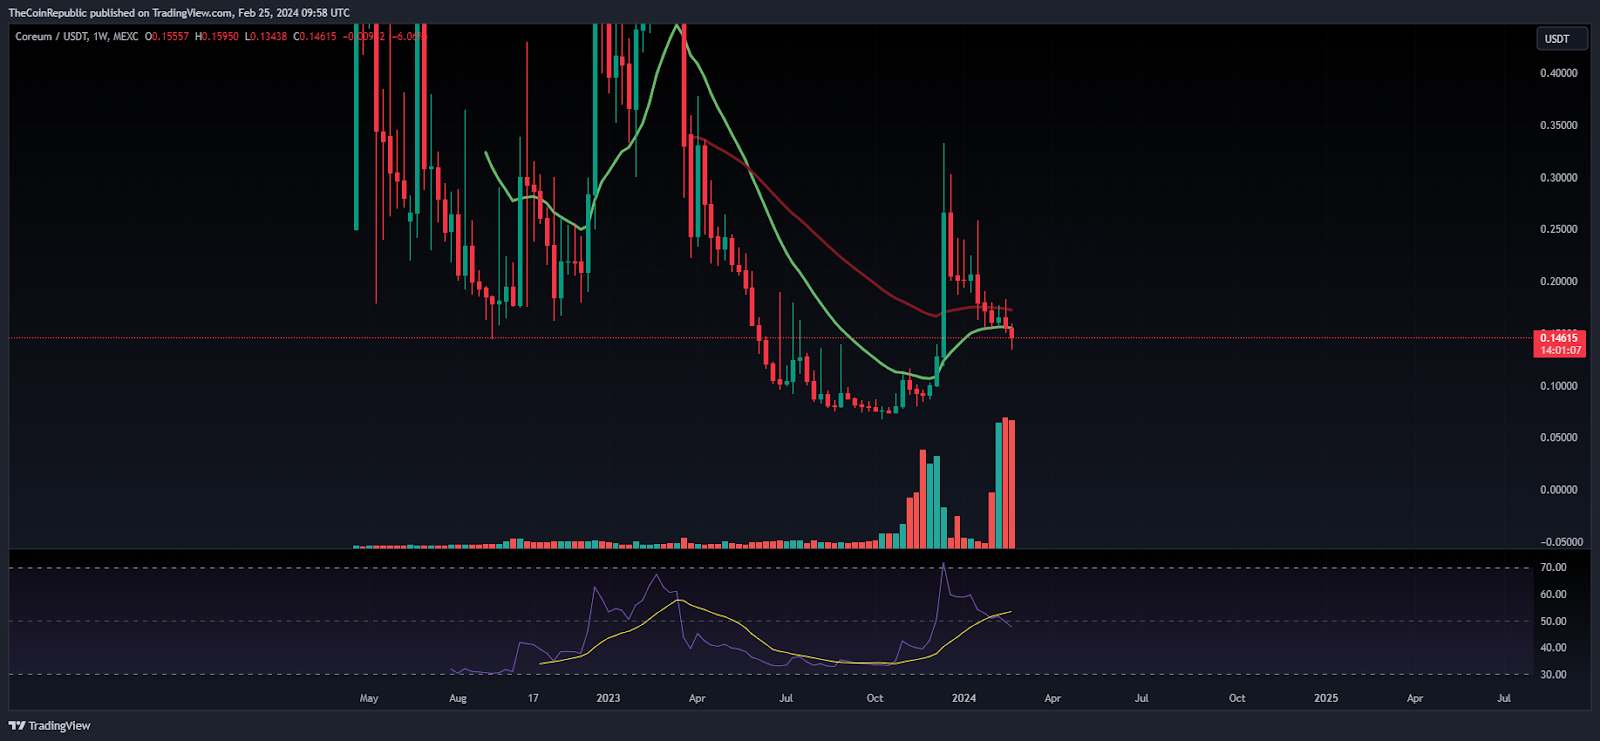
The token witnessed volatile moves on the weekly charts and replicated pump-and-dump price movements. Recently, the token showed a massive bounce from the demand zone of $0.0700 and retested $0.3000, but instead of follow-on buying momentum, a panic selloff was witnessed, leading to a decline in the past few weeks. The technicals are signaling that a correction might lead to a retesting of the lows of $0.07000 in the following sessions.
Summary
The Coreum token (COREUM) price has slipped below the 200-Day EMA support zone and is indicating that a selloff may be triggered $0.1000 soon. The price action reveals massive short additions, and the bulls look hopeless and will stay on the back foot.
Technical Levels
Support Levels: $0.1200 and $0.1000
Resistance Levels:$0.1600 and $0.1800
Disclaimer
The views and opinions stated by the author or any other person named in this article are for informational purposes only and do not constitute financial, investment, or other advice.

With a background in journalism, Ritika Sharma has worked with many reputed media firms focusing on general news such as politics and crime. She joined The Coin Republic as a reporter for crypto, and found a great passion for cryptocurrency, Web3, NFTs and other digital assets. She spends a lot of time researching and delving deeper into these concepts around the clock, and is a strong advocate for women in STEM.


