
 Home
Home News
News

- 1 TRON price is currently trading above the key moving averages, supporting bulls.
- 2 TRON price was down last week, demonstrating the presence of sellers in the last few sessions.
TRON price is currently trading in a bullish range, trading above the key moving averages. Bears are trying to push the price below the critical support levels. However, sellers are getting tough competition from buyers as they are in control of the trend.

TRON price forecast for March 2024 suggests the price is in the bullish momentum and buyers have a proper grasp over the price. However, buyers have an edge over sellers as in previous months, there was a sharp spike in price.

The price action of the TRON crypto indicates that if the price sustains above the current support levels, it might touch higher levels in the upcoming sessions. Moreover, if the price is unable to sustain at the current support levels, it may see further downside.
Despite the recent weakness in the price, it is still trading above the 50-day and 200-day EMAs. That shows buyers are still active and the price might take a reversal from the current 20-Day EMA support level.
CoinMarketCap data shows that the current price of TRON stands at $0.1375 with an intraday incline of 0.02%, but the volume has decreased by 23%. The current market cap of the crypto is $12.13 Million and the 24-hour trading volume is $198.48 Million.
The performance of the crypto has been volatile over the period. Year-to-date, it gave a return of 27.84%. In the last 6 months, it has increased by 80.17%, and in the previous 3 months, the returns were 27.78%. TRON has faced a mild bearishness in recent sessions.
Moreover, as per the TradingView, the technicals are on the buying side. Out of 26 indicators, 4 are on the selling side, 8 are on the neutral side and 14 are on the buying side. The indicators summary of the trading view is dominating on the buying side.
TRON Price Technical Analysis
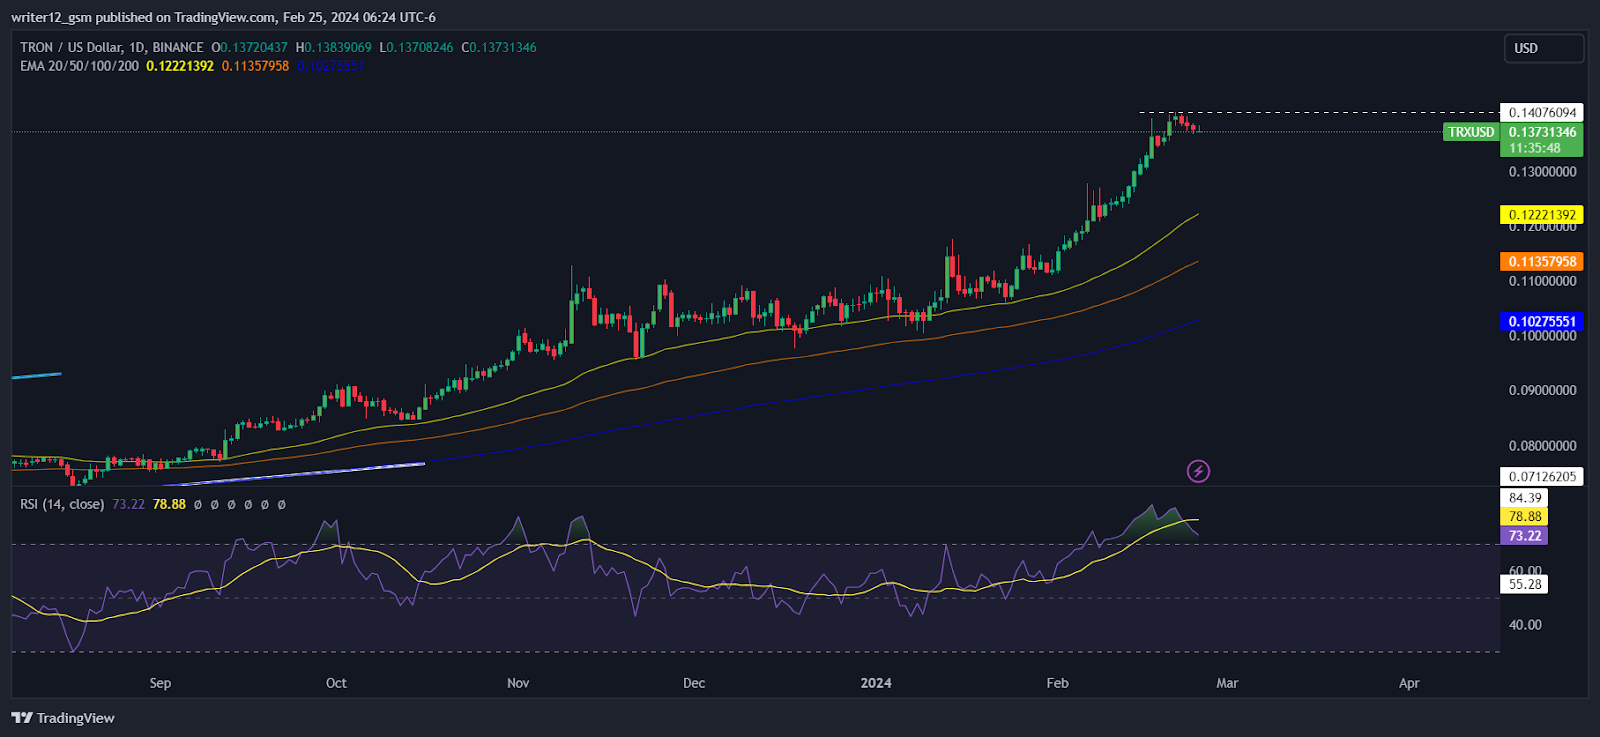
TRON price is trading above the major EMAs, showing the buyers’ presence. Moreover, the RSI curve is trading in the overbought zone, showcasing bullishness in the price. The RSI curve is hovering at 74.83 and the 14-day SMA is at 79.00 heading towards the oversold zone.
The MACD curve is also facing downward. A bearish cross is imminent. Overall the technical indicators indicate bullishness in the price.
Conclusion
TRON price forecast is demonstrating bullishness in the price. Buyers have a good grasp on the price as the returns year to date have been positive. Technical indicators including the MACD, RSI, and EMAs indicate bullishness in the price.
Technical Levels
Support Level: $0.12223202
Resistance Levels: $0.14076094
Disclaimer
This article is for informational purposes only and does not provide any financial, investment, or other advice. The author or any people mentioned in this article are not responsible for any financial loss that may occur from investing in or trading. Please do your research before making any financial decisions.

With a background in journalism, Ritika Sharma has worked with many reputed media firms focusing on general news such as politics and crime. She joined The Coin Republic as a reporter for crypto, and found a great passion for cryptocurrency, Web3, NFTs and other digital assets. She spends a lot of time researching and delving deeper into these concepts around the clock, and is a strong advocate for women in STEM.


