
 Home
Home News
News
- 1 OOE token price has picked up momentum and registered a breakout.
- 2 The OpenOcean token witnessed a massive bounce and retested the neckline of $0.02500.
The OpenOcean token price bounced from the 20-Day EMA and surged over 40% in the last three trading sessions. This rise led sellers into trouble and investors are making the most of it. Additionally, the token has crossed the horizontal neckline of $0.02000 and signifies buying momentum on the charts. The token was in a retracement phase for the past few weeks but has now reverted from the demand zone.
OOE token price has escaped the significant moving averages and is conveying positive sentiments, suggesting a bullish trend ahead. Moreover, the token has picked momentum and is ready to spark bullishness. The token marked a breakout at the start of March. If bulls succeed in sustaining above $0.02500, a much-awaited rally may be seen shortly. Per the Fib levels, the token has crossed the 38.2% zone and is heading toward the 50% zone.
The OpenOcean token (OOE) price was $0.02457 at press time, with an intraday drop of 2.84%, showing neutrality on the charts. Moreover, the trading volume has increased by 6.98% to $449.019, revealing investor interest. The pair of OOE/BTC is at 0.000000383 BTC, and the market cap is $11.90 Million. OOE token has a weekly return ratio of 34.01% and 66.35% on a monthly basis, revealing a bullish outlook. Analysts are neutral and suggest that the OpenOcean crypto (OOE) price has initiated a breakout and might continue to outperform in the upcoming sessions.
OOE Reveals Bull Accumulation On Daily Charts
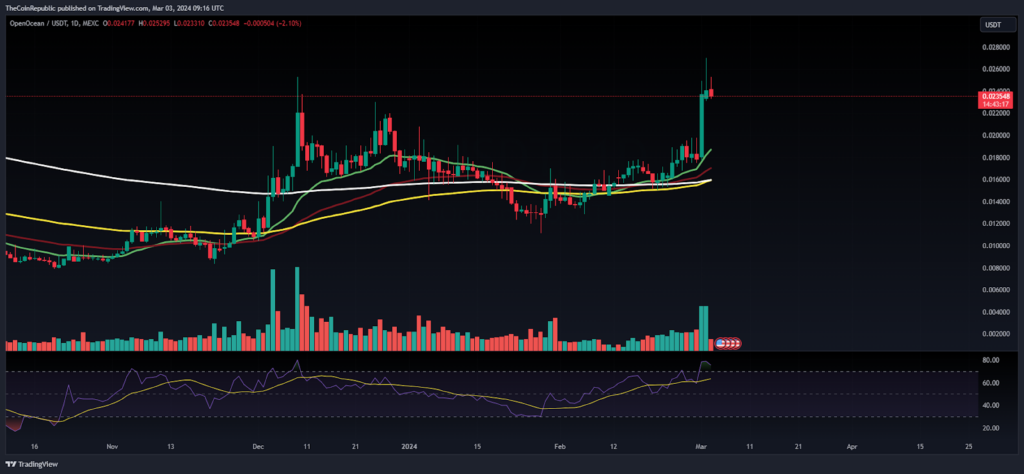
After three months, the token has retested the neckline hurdle of $0.02500 and is ready to give a massive breakout soon. OOE token price has replicated a golden crossover and suggests a bullish outlook. Like most Altcoins, OpenOcean token also shows buying interest in the bullish crypto market.
The RSI curve floats in the overbought zone, signifying bullishness on the charts. Similarly, the MACD indicator showcased a bullish crossover and suggested a bullish rally for the following sessions.
OpenOcean Exhibits Falling Wedge Breakout On Weekly Charts
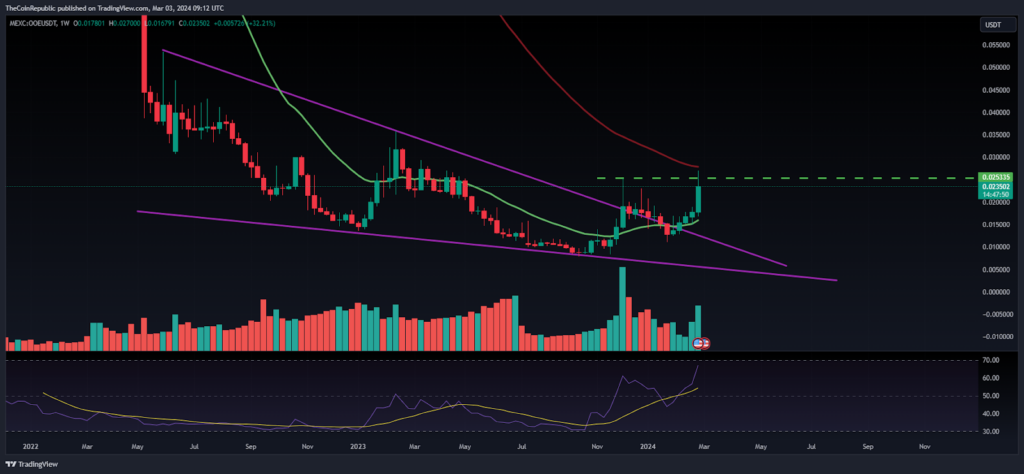
On the weekly charts, the OOE token has registered a falling wedge pattern breakout, and a bounce was noted, post retest of the neckline support zone of $0.02000, which signals the bounce is trustworthy. The token will continue to extend the gains and may catch the upside of $0.03000 soon.
Summary
The OpenOcean token price has reverted from the demand zone and has retained bullishness, intending to cross the $0.02500 mark. Moreover, the trend is intact, and bulls are looking aggressive. A bull rally is likely in the upcoming sessions.
Technical Levels
Support Levels: $0.02000 and $0.01800
Resistance Levels:$0.02580 and $0.02800
Disclaimer
The views and opinions stated by the author or any other person named in this article are for informational purposes only and do not constitute financial, investment, or other advice.

Andrew is a blockchain developer who developed his interest in cryptocurrencies while pursuing his post-graduation major in blockchain development. He is a keen observer of details and shares his passion for writing, along with coding. His backend knowledge about blockchain helps him give a unique perspective to his writing skills, and a reliable craft at explaining the concepts such as blockchain programming, languages and token minting. He also frequently shares technical details and performance indicators of ICOs and IDOs.


