
 Home
Home News
News
- 1 Shiba Inu crypto price is currently trading at $0.00002207 with a 2.30% drop in the last 24 hours.
- 2 Shiba Inu SHIB crypto price was trading with strong uptrend momentum in the intraday trading session.
- 3 SHIB crypto price has recovered above 20-EMA to reach the 50, 100, and 200-Day Daily Moving Averages.
Shiba Inu crypto is displaying a strong performance and is approaching the $0.00002500 level. This positive trend suggests that there is a possibility of an upward move towards the anticipated target of $0.00003000. Consequently, those who support a bullish market are likely to maintain their long cryptocurrency positions. Shiba Inu crypto is currently trading above major moving averages, indicating a bullish mood in the market.
Additionally, chart structures based on recent trading sessions show a bias in favor of buyers. The cryptocurrency has gained momentum and is poised for an uptrend that could reach upper levels. The increased activity and momentum also support the optimistic outlook of market buyers.
At the time of publication, Shiba Inu Crypto was trading at $0.00002207 with an intraday gain of 2.30%, showing extreme bullish sentiment and a positive outlook on the charts. Additionally, the intraday trading volume was $4.34 Billion and the market capitalization was $12.92 Billion.
However, as buying volume increases, the price can create higher highs and new highs to maintain bullish momentum. Therefore, Shiba Inu price is expected to move higher and remain strong on the daily chart.
Technical Analysis of Shiba Inu Crypto Price in 1-D Timeframe
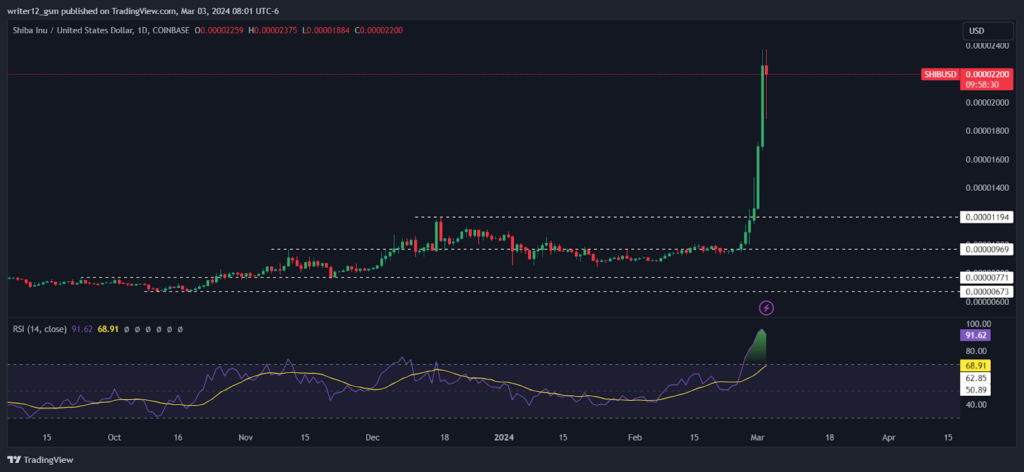
Currently, Shiba Inu Crypto (USD: SHIB) is trading above its 50 and 200-Day simple moving averages (SMAs). The current RSI value is 91.55 points. The 14 SMA is above the midline at 68.90 points, indicating a bullish trend for Shiba Inu Crypto. The MACD line at 0.00000235 and the signal line at 0.00000100 are above the zero line.
There is a bullish crossover on the MACD indicator, which indicates strength in the price momentum of the SHIB cryptocurrency.
Stochastic RSI is in overbought levels. The %D and %K lines are crossing each other in a positive direction indicating bullishness. Shiba Inu Cryptocurrency Weekly Statistics Shiba Inu Crypto’s weekly chart shows buyers dominating. The cryptocurrency is in an uptrend as it jumped above the main EMA.
Technical indicators also support the bullish sentiment as the RSI is close to the positive zone of 85 and MACD has formed a bullish crossover with the green band. These signals indicate that the cryptocurrency could face even greater upward momentum in the coming weeks.
Summary
The technical oscillator for Shiba Inu cryptocurrency (SHIB) is indicating a bullish trend. The Moving Average Convergence Divergence (MACD), Relative Strength Index (RSI), and Exponential Moving Average (EMA) are all showing positive signals, signaling that the price of SHIB may continue to rise. Daily charts reflect optimism.
Technical Levels
Support Levels: $0.00001194
Resistance Levels: $0.00002500
Disclaimer
This article is for informational purposes only and does not provide any financial, investment, or other advice. The author or any people mentioned in this article are not responsible for any financial loss that may occur from investing in or trading. Please do your own research before making any financial decisions.
Mr. Pratik chadhokar is an Indian Forex, Cryptocurrencies and Financial Market Advisor and analyst with a background in IT and Financial market Strategist. He specialises in market strategies and technical analysis and has spent over a year as a financial markets contributor and observer. He possesses strong technical analytical skills and is well known for his entertaining and informative analysis of the Financial markets.


