
 Home
Home News
News

- 1 ETC crypto price has shown 18 green days in the last 30 days.
- 2 Ethereum Classic has high liquidity based on its market cap.
Ethereum Classic (ETC) is a decentralized blockchain platform utilizing a proof-of-work consensus algorithm. It facilitates the execution of smart contracts and dApps written in Solidity, enabling token issuance, exchange, and development of projects emphasizing immutability and censorship-resistance.

Ethereum Classic is trading with a similar amount of total supply and the max supply resulting in 210.7 Million ETC. This further is followed by a circulating supply of 145.86 Million ETC and the fully diluted market cap of the crypto is $7.169 Billion.

The trading volume of the crypto has declined by 45.55% in just the last 24 hours resulting in a traded value of $556.584 Million. Also, the market cap ranking of the crypto is #23 followed by a market cap dominance of 0.2%.
The market cap value of the Ethereum Classic is $4.964 Billion which has witnessed an advance of 2.6% in the last 24 hours. Furthermore, 10.98% of the total market cap of the crypto is traded in the last 24 hours.
The volatility of the crypto is also relatively high resulting in 8.0% and the supply inflation of the Ethereum Classic is also high and the sentiment of the crypto is bullish. The stablecoin market cap of the crypto is $23.7K and the total value locked for the same is $632.8K.
Ethereum Classic Crypto Derivatives Analysis
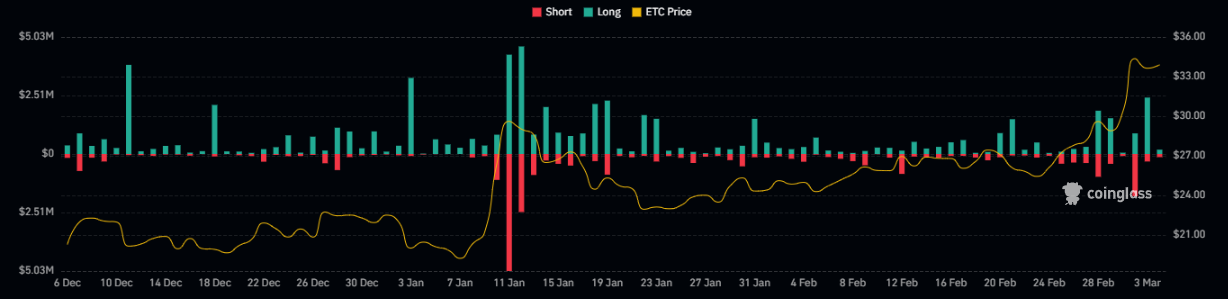
In the last 24 hours, Ethereum Classic crypto witnessed a higher long liquidation of $209.84K and the short liquidation for the crypto is worth $162.81K. This results in a long/short ratio of 0.938.
Furthermore, the derivatives trading volume of the crypto has declined by 47.04% and the open interest has further witnessed a decline of 1.69% in the last 24 hours. This has resulted in a traded volume of $755.06 Million and the open interest stands at $269.06 Million.
ETC Crypto Technical Analysis
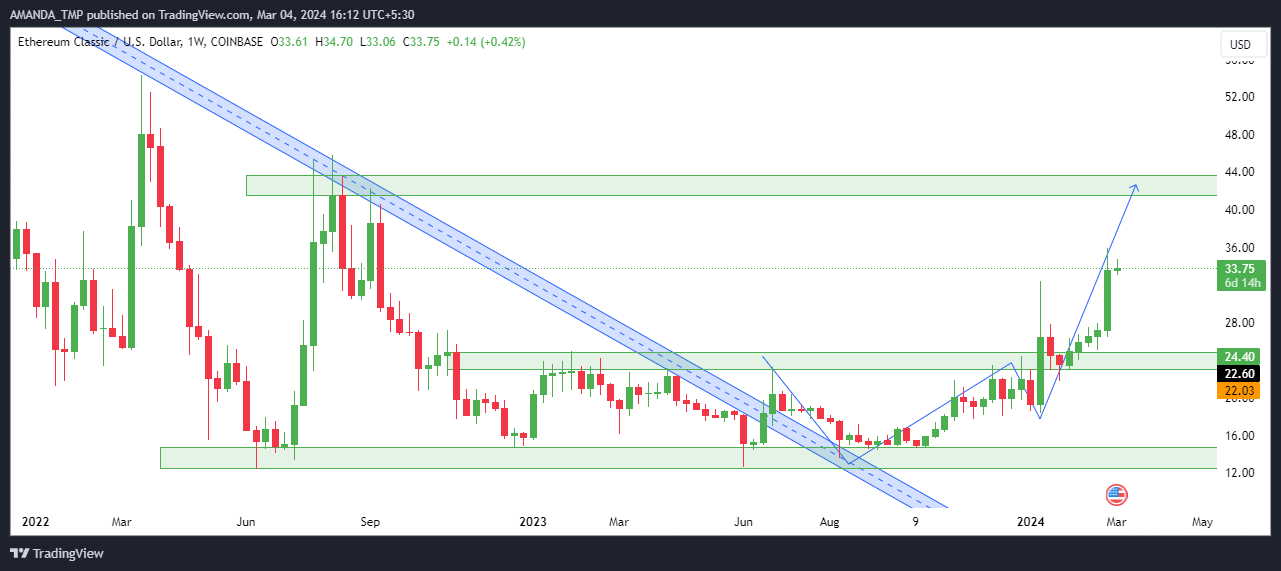
Following two chart patterns on the weekly timeframe, the price of the crypto was trading inside a descending triangle pattern and a parallel wedge pattern. Over time, the price of the ETC crypto broke out above the descending triangle pattern but lacked volume.
Due to the lack of volume, even after the breakout of the triangle pattern, the price of the crypto consolidated inside the wedge pattern for a long time. The price of the crypto further broke above the parallel wedge pattern with strong volume and momentum.
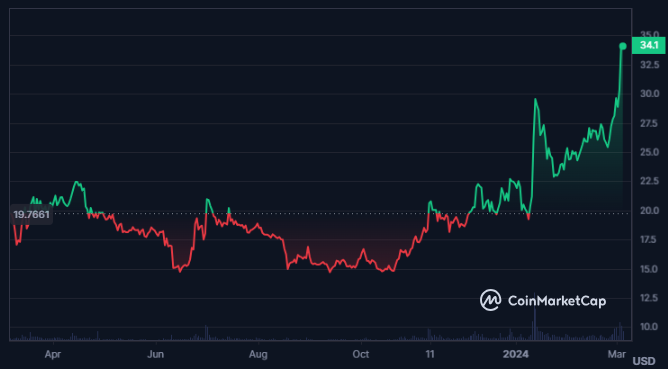
The following phenomenon led to a rise of more than 35% in price since the breakout. Furthermore, the price of the crypto is following a strong bullish price action and the price might lead to further higher levels.
ETC/USD Chart by TradingView.com
The daily chart of the ETC crypto price followed by the crucial technical indicators indicates a strong bullish trend on the chart.
The price of the crypto is trading above all the crucial EMAs. The 50 and 200-Day EMAs on the daily chart are trading in a golden cross while the 20-Day period EMA is also trading above the following EMAs.
The following behavior of the EMAs represents bullish sentiment in the crypto price.
The MACD indicator also gave a buy signal a few days ago and the ETC crypto price is following the same signal followed by an advance in the trading price. The histograms can be seen rising on the daily chart and so the price of the crypto.
The RSI has also advanced to the overbought zone by breaking above the 14-day SMA line and the 50-level on the chart. It is currently trading at a level of 74.66 and has been sustaining above the 50 level for a long time.
The following behavior of the RSI represents string momentum in the crypto price which indicates the continuation of buying pressure in the crypto.
Summary
Ethereum Classic (ETC) shows bullish momentum with a price increase of over 35% post-breakout from chart patterns. Technical indicators including the EMAs, MACD, and RSI support a bullish trend, with RSI in the overbought zone. Thus, ETC’s strong performance suggests a potential for further price rise.
Disclaimer
This article is for informational purposes only and does not provide any financial, investment, or other advice. The author or any people mentioned in this article are not responsible for any financial loss that may occur from investing in or trading. Please do your research before making any financial decisions.

With a background in journalism, Ritika Sharma has worked with many reputed media firms focusing on general news such as politics and crime. She joined The Coin Republic as a reporter for crypto, and found a great passion for cryptocurrency, Web3, NFTs and other digital assets. She spends a lot of time researching and delving deeper into these concepts around the clock, and is a strong advocate for women in STEM.


